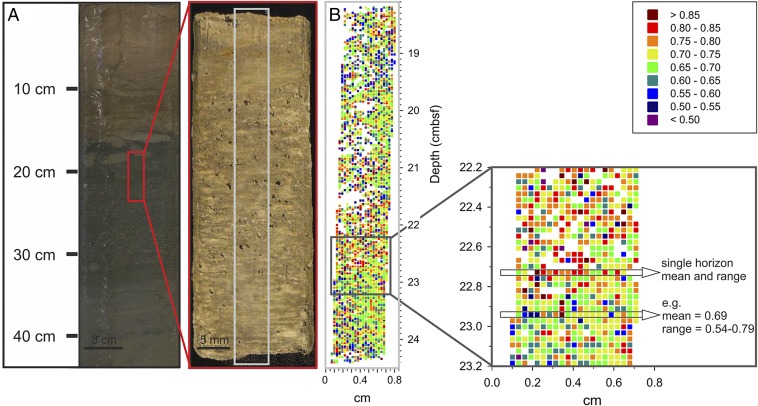
Fig. 2.
(A) Photograph of sediment section of core GeoB 15103–1 (eastern Mediterranean Sea) used for high-resolution LDI FTICR-MS analysis. The section corresponds to the upper part of sapropel 1. (B) CCaT values for each analyzed spot, exemplary zoom-in, and average and range values for two selected horizontal layers. White fields in figure indicate spots in which GDGTs could not be detected in sufficient concentration, possibly due to inefficient ionization.

