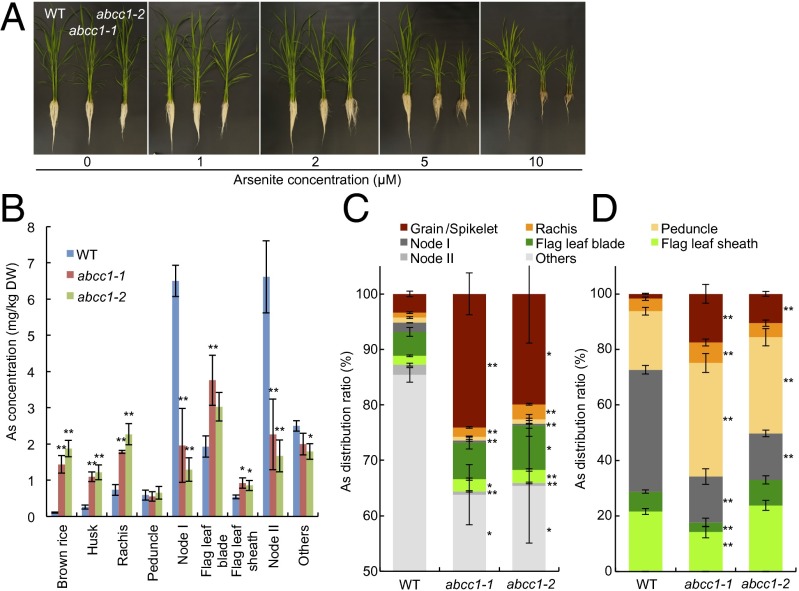
Fig. 5.
Phenotypic analysis of osabcc1 mutants. (A) The As tolerance test. Seventeen-day-old seedlings of wild-type (WT) rice and two OsABCC1 knockout lines (abcc1-1 and abcc1-2) were exposed to a nutrient solution containing different As concentrations. After 2 wk, the plants were photographed. (B and C) The As concentration (B) and distribution (C) in different organs at the ripening stage. Both wild-type rice and two knockout mutants were grown in soil containing 1.3 mg As per 1 kg soil. Different organs were sampled and subjected to As determination. The distribution of As in organs above node I was calculated; specifically, the amount of As accumulated in each organ versus the total As accumulated in the aboveground parts was determined. Data are means ± SD of three biological replicates. (D) Short-term As distribution in different organs. The plants were cut at the second upper internode below node II and then fed with 10 µM As(III) solution at the cut end. After 24 h, each organ was separately harvested for As determination. Data are means ± SD of four to five biological replicates. Significant differences from WT at *P < 0.05 and **P < 0.01 by Tukey’s test.

