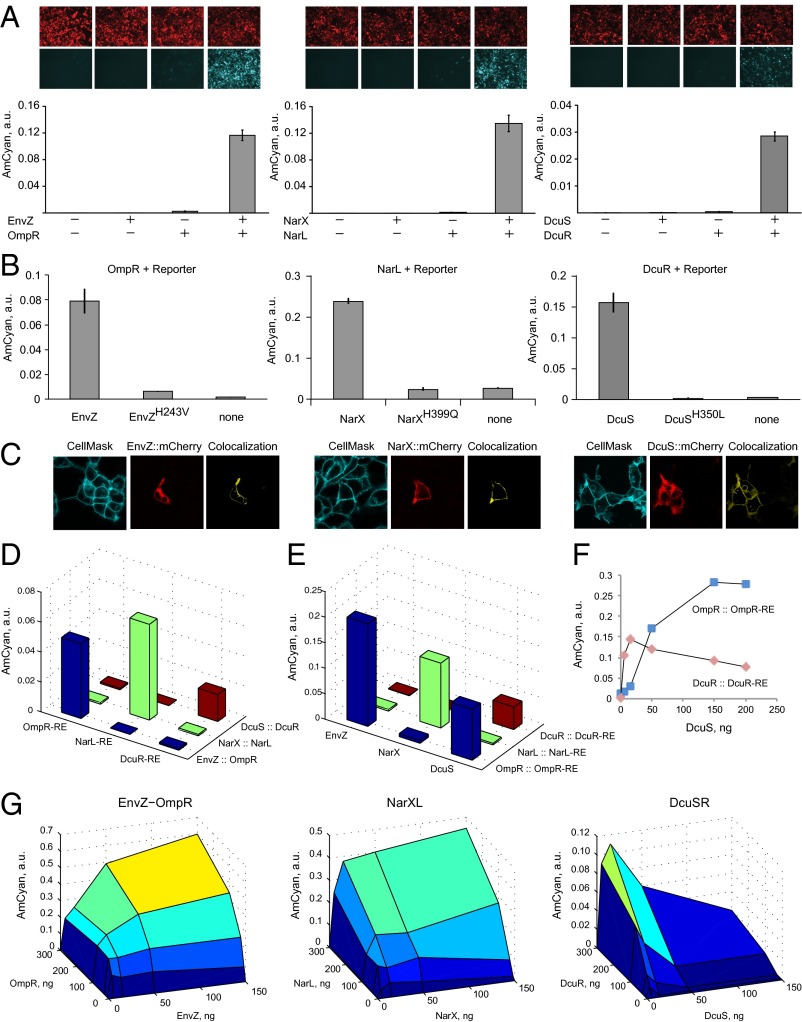
Fig. 2.
Characterization of the transplanted TCS pathways. (A) Component requirements for RE activation. Each component combination is accompanied by representative microscopy pictures with red pseudocolor indicating DsRed transfection marker, and cyan pseudocolor indicating pathway-induced AmCyan protein output. The bar charts display AmCyan level in a.u. as mean ± SD of independent biological triplicates. Plasmid composition and output values are in SI Appendix, Tables S2 and S3. (B) Loss of function via mutating catalytic histidine residues of HKs (references 2, 8, and 9 in SI Appendix). Each bar chart shows, left to right, the readout with wild-type HK, mutated HK, and without HK gene. Plasmid composition and output values are in SI Appendix, Tables S4 and S5. (C) Cellular localization of the HK::mCherry fusion proteins. CellMask membrane stain is shown in cyan, Cherry is shown in red, and colocalized region (yellow) was calculated using Imaris software. (D) Cross-talk of HK::RR pairs with noncognate response elements. Plasmid composition and output values (including SD) are in SI Appendix, Tables S6 and S7. (E) Cross-talk of noncognate HKs with RR::RE pairs, indicating that DcuS phosphorylates OmpR. Plasmid composition and output values (including SD) are in SI Appendix, Tables S8 and S9. (F) Detailed look into the DcuS-OmpR cross-talk. DcuS-OmpR interaction is displayed using blue markers and cognate DcuS-DcuR is shown with red markers. Data points are duplicate averages. Plasmid composition and output values (including SD) are in SI Appendix, Tables S10 and S11. (G) The relationship between the amounts of HKs and RRs and the reporter level. For each surface plot, all pairwise combinations of HK and RR were measured with HK at 0, 5, 50, and 150 ng per transfection in a 12-well plate and RR at 0, 10, 30, 100, and 300 ng. Filler DNA was added to keep the total DNA amount constant. All data points are duplicate averages. Output values are in SI Appendix, Table S12. Different colors represent output intensity from dark blue (low) to yellow (high).

