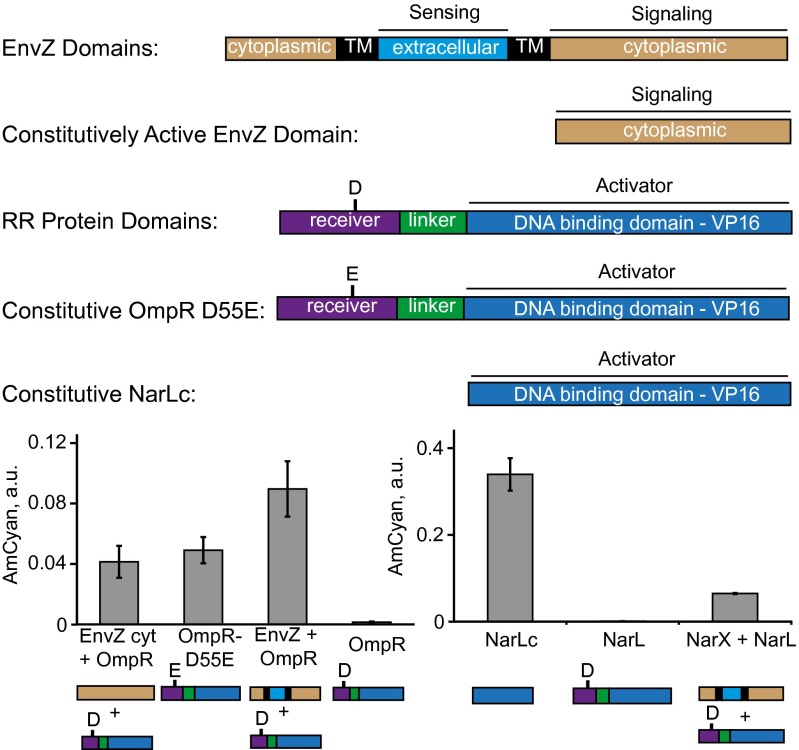
Fig. 4.
Activity of mutant TCS components. Full-length, truncated, and mutant TCS genes are shown with each protein domain color-coded and labeled. Experimental data are given below. Each bar represents mean ± SD of a biological triplicate. The output values for NarX + NarL and NarL are from Fig. 3B; they are displayed again for side-by-side comparison. Plasmid composition and output values are in SI Appendix, Tables S17 and S18. TM, transmembrane domain.

