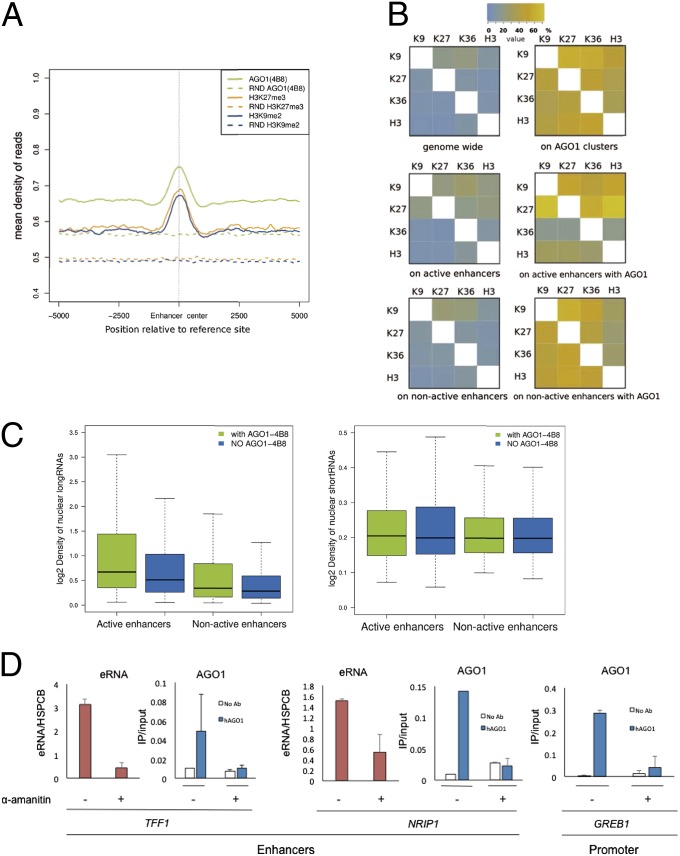
Fig. 2.
AGO1 association with silencing marks and RNA at enhancers. (A) Density of ChIP-seq reads for AGO1 (4B8 antibody), H3K9me2, and H3K27me3 centered at enhancers. The dashed lines correspond to the read densities from randomized clusters. (B) Association of histone marks genome-wide and on enhancers, in relation to the presence of AGO1 binding. The heat maps indicate the proportion (percentage of clusters) of significant sites with a given chromatin signal (rows) that overlap with each chromatin signal (columns). (Left) The data for overlaps genome-wide (Top Left), on active enhancers (Middle Left), and on nonactive enhancers (Bottom Left). (Right) The proportion of overlap (percentage of clusters) of the same histone marks at sites with AGO1: genome-wide (Top Right), on active enhancers (Middle Right), and on nonactive enhancers (Bottom Right). (C) Density of long (Left) and short (Right) nuclear RNA-seq reads from MCF7 cells in active and nonactive enhancers with (green) and without (blue) AGO1 binding, respectively. (D) Effects of treating MCF7 cells with 2.5 µg/mL alpha-amanitin for 20 h on the abundance of eRNAs (pink bars) and on the AGO1 ChIP signal (blue bars) on the TFF1 and NRIP1 transcriptional enhancers (Left and Center, respectively) and on the GREB1 promoter (Right). White bars correspond to ChIP signals in the absence of antibody. eRNAs and DNA from ChIP were quantified by real-time PCR using specific primers. In all experiments n = 2 except for NRIP AGO1 signal, where n = 1.

