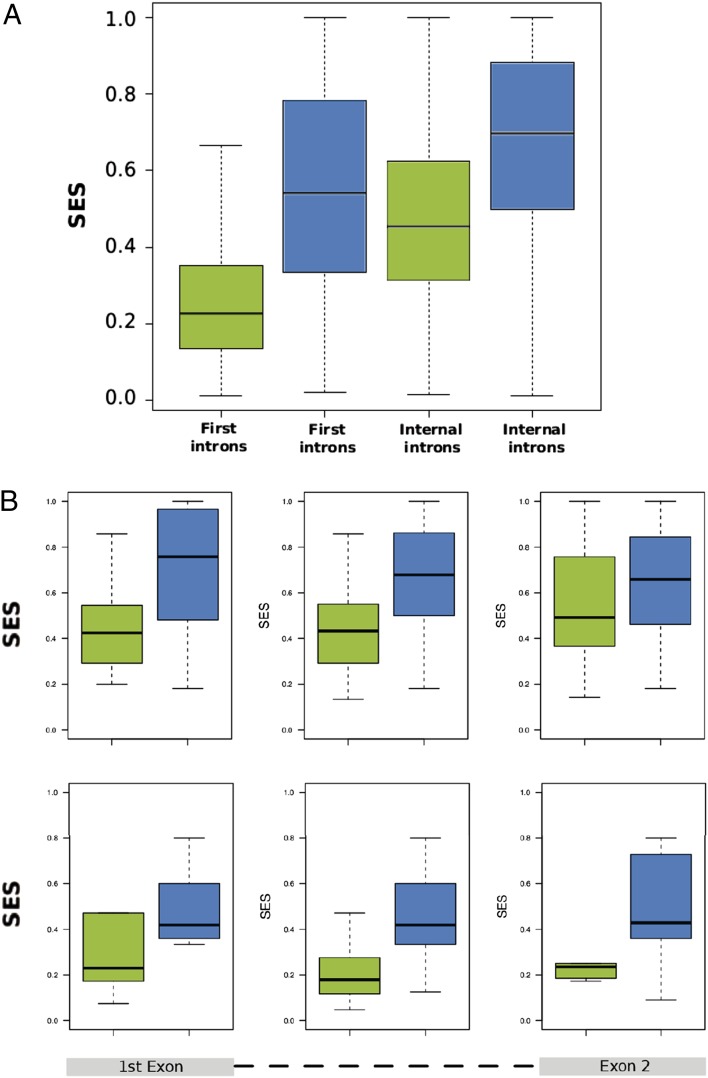
Fig. 3.
AGO1 affects constitutive splicing. (A) SES (Methods) distributions depicted as boxplots in the samples siLuc (green) and siAGO1 (blue) for the introns with significant SES change. Kolmogorov–Smirnov test of the comparison of the distributions yields P = 3.331e-16 for first introns and P < 2.2e-16 for internal introns. (B) Distribution of SES scores for introns with AGO1 binding according to the location of the AGO1 clusters in internal introns (Upper) and first introns (Lower). We considered three possible configurations: AGO1 overlaps with the upstream exon (Left), with the downstream exon (Right), or it is entirely located in the intron (Center).

