Fig. 5.
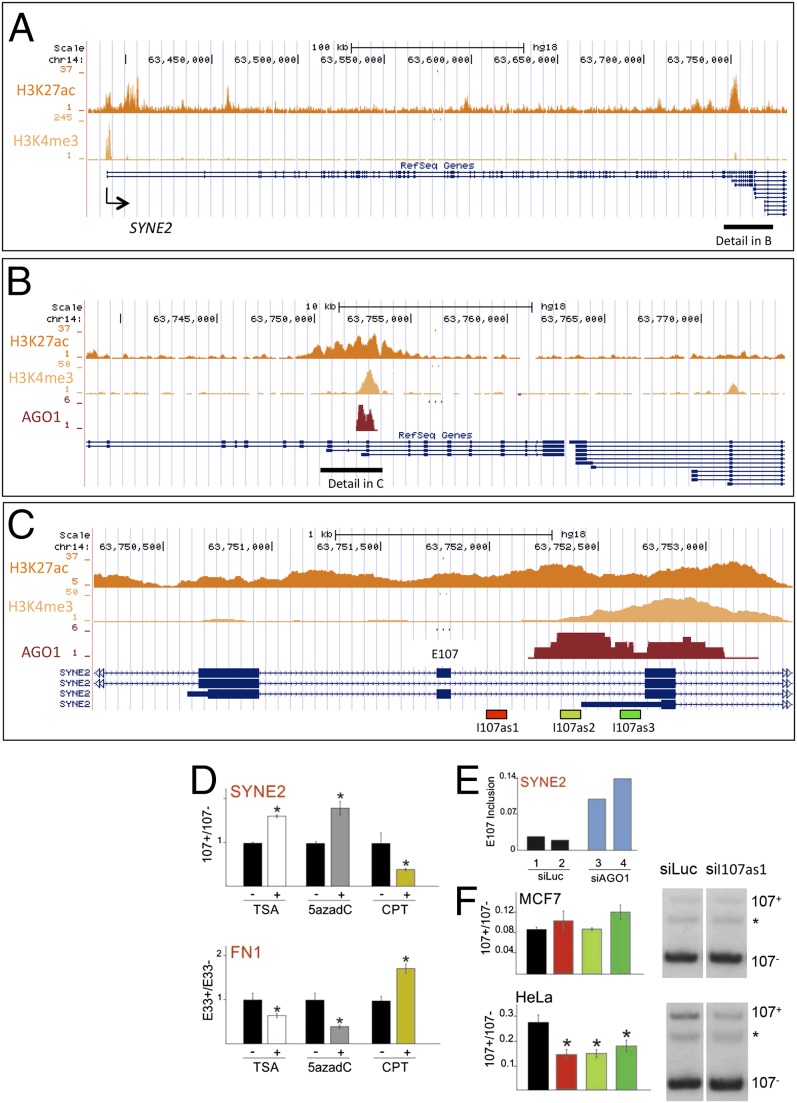
SYNE2 alternative splicing is regulated by AGO1. (A) Genomic locus of the SYNE 2 human gene indicating the distribution of the H3K27ac and H3K4me3 marks. (B) Higher resolution of the SYNE2 gene corresponding to the region encompassed by the black horizontal line in A, showing overlap of the H3K27ac and H3K4me3 marks with a conspicuous AGO1 cluster. (C) Detail of the SYNE2 gene around exon E107 corresponding to the region encompassed by the black horizontal line in B. (D) Effect of different drugs affecting RNAPII elongation on alternative splicing of SYNE2 exon E107 and fibronectin exon E33. The elongation-promoting reagents TSA and 5azadC increase E107 inclusion (Upper), whereas they cause E33 skipping (Lower). Conversely, the inhibitor of elongation CPT promotes E107 skipping but increases E33 inclusion. (E) Transfection of MCF7 cells with siAGO1, using siLuc as control, increases SYNE2 E107 inclusion. (F) Effects of intronic siRNAs in MCF7 (Upper) and HeLa (Lower) cells on E107 alternative splicing. E107+/E107− and E33+/E33− ratios were determined using reverse transcriptase-radioactive PCR (RT-rPCR). Gel images for the RT-PCRs of siLUC and siI107as1 experiments are shown on the right of each quantification. The asterisk indicates a spurious band. Note that in HeLa cells siI107as1 not only decreases the intensity of the inclusion band (E107+) but also decreases the intensity of the exclusion band (E107−).

