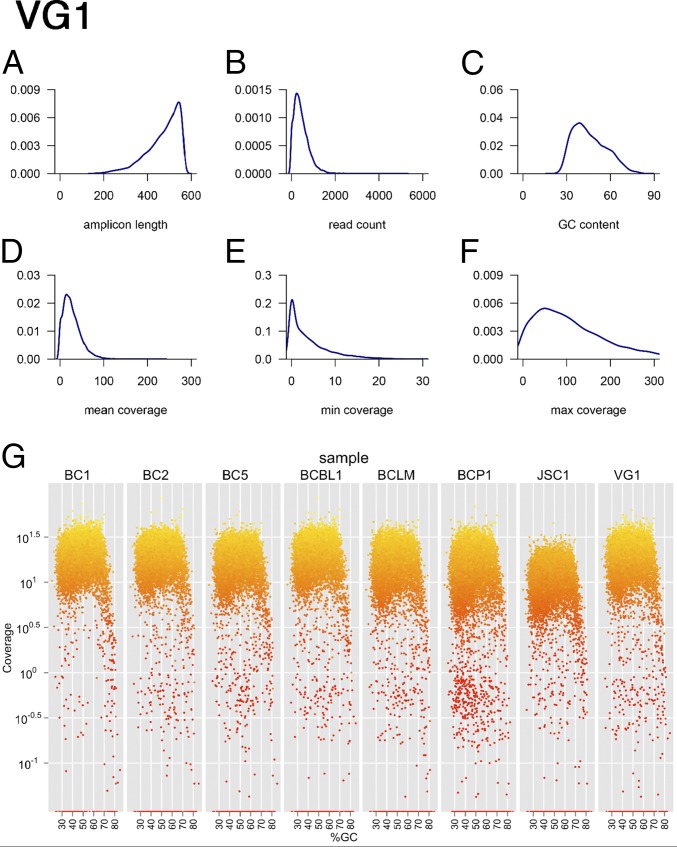
Fig. 1.
Individual quality control (QC) of droplet-PCR enrichment and sequencing. Shown are six density curves representing the distribution of (A) the predicted amplicon length in the PCR, (B) the read-count per amplicon, (C) the GC-content across all PCR amplicons, (D) the mean coverage, (E) the minimal coverage, and (F) the maximal coverage on each position using the read data for the VG1 PEL as an example. (G) Coverage by GC-content. Shown are n = 8 samples and how coverage changes with amplicon GC-content. Data were from the discovery, single-lane multiplexed QC run, not the final data set, which includes additional sequencing runs. The final coverage is reported in Table 1. The vertical axis shows coverage on a log10 scale; the horizontal axis shows the %GC-content of each amplicon. Colors indicate coverage of each amplicon, with bright yellow indicative of higher and dark red of lower coverage. Note the drooping tail at >70% GC-content in all samples, which represents the maximal GC-content compatible with this type of PCR.

