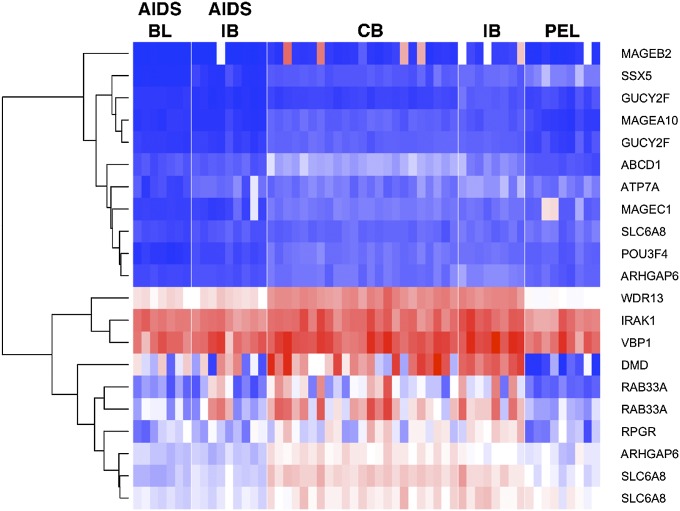
Fig. 2.
Heat map of transcription for highly mutated genes in PEL and other types of DLBCL. The expression values are derived from Affymetrix CEL data (GEO data set GDS1063). Red color represents high, white intermediate, and blue low expression levels. The genes shown on the vertical axis are the subset of the highly mutated genes reported in Table 2. Individual sample identifiers are shown on the bottom and classes on the top. BL, Burkitt lymphoma; CB, centroblastic; IB, immunoblastic.

