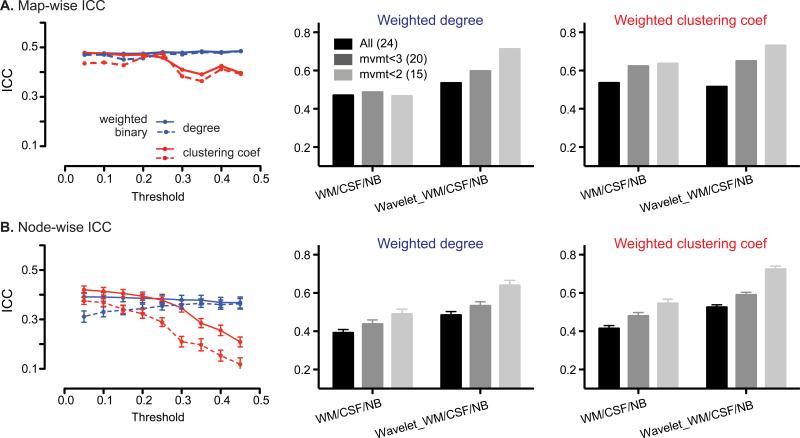
Figure 4. Reliability of graph theoretical analysis.
A.left panel, map-wise ICCs across different thresholds, for degree (blue) and clustering coefficient (red) from weighted (solid line) and binary (dashed line) adjacency matrices. Map-wise ICCs of degree (middle panel) and clustering coefficient (right panel) from the weighted matrix thresholded at r > 0.05, for all subjects (black), mvmt<3 (gray) and mvmt<2 (light gray) groups, without and with wavelet transformation at scale 3. B. left panel, mean node-wise ICCs across different thresholds, for degree (blue) and clustering coefficient (red) from weighted (solid line) and binary (dashed line) adjacency matrices. Mean node-wise ICCs for degree (middle panel) and clustering coefficient (right panel) from weighted matrix threshold at r > 0.05, for all subjects (black), mvmt<3 (gray), and mvmt<2 (light gray) groups, without and with wavelet transformation at scale 3. Error bars signify s.e.m. across nodes. WM, white matter; NB, non-brain; Wavelet, wavelet transformation at scale 3.

