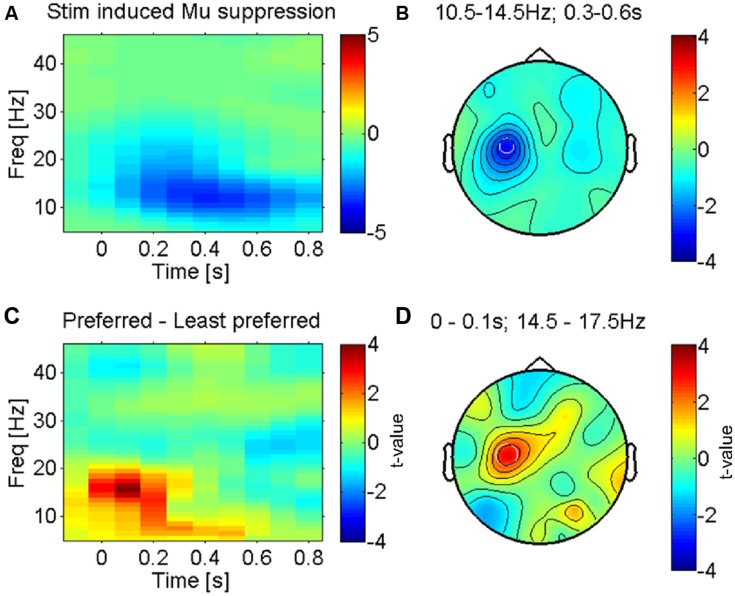
FIGURE 2.
Somatosensory mu-suppression in response to tactile caressing of the forearm. (A) Time-frequency representation of stimulus induced suppression of somatosensory mu-oscillations, the most prominent brain response to afferent stimulation (from electrode ‘C3’ as indicated in B). Averaged across all conditions (fabrics). (B) Topography of this effect (10.5–14.5 Hz and 0.3–0.6 s after stimulus onset) against baseline, averaged across conditions. The effect is dominant over the left somatosensory cortex (electrode ‘C3’), contralateral to the side of stimulation (right forearm), as expected. (C) Time-frequency profile of the direct statistical comparison (dependent sample t-test) between oscillatory power in ‘C3’ for preferred and least preferred fabrics. A significant difference emerges just after stimulus onset in the higher mu-band (14.5–17.5 Hz). (D) Topography of this effect is consistent with the well-known mu-suppression (peak in ‘C3’) and therefore presumably the somatosensory cortex, see text.

