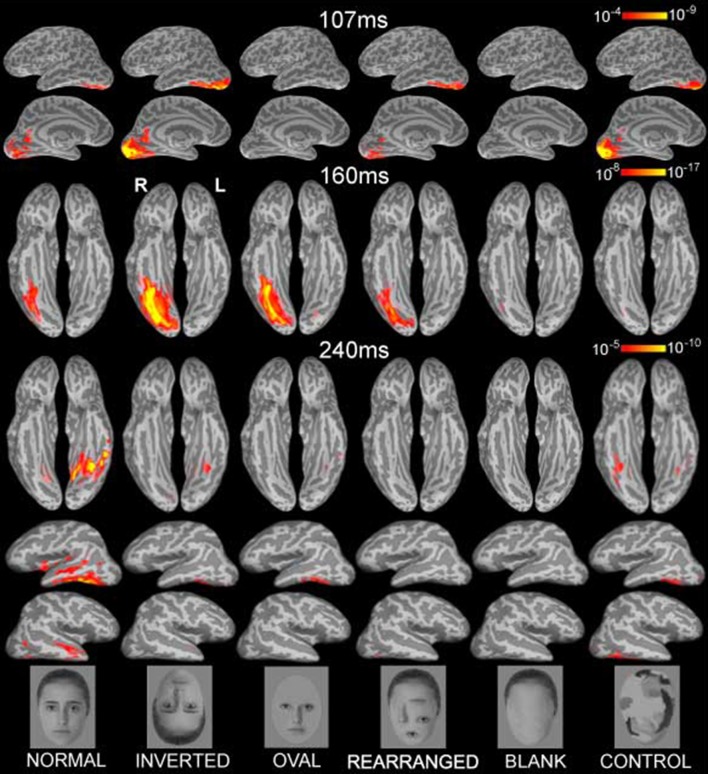
Figure 1.
Group-based average dynamic statistical parametric maps of estimated activity to all six conditions on ventral surfaces at ~107 ms, ~160 ms, and at ~240 ms, showing estimates in ventral and lateral views. Early visual activity (at ~107 ms) is stronger to inverted faces and control stimuli. Inverted faces evoked the strongest M160 activity estimated to the fusiform gyrus, followed by oval, normal and rearranged images. Blank faces and randomized control faces evoked the weakest activity. The subsequent deflection, peaking at ~240ms was largest to normal faces in the ventral and anterolateral temporal areas bilaterally. Examples of the images are shown below. The individual in the photos consented to the publication of these images.

