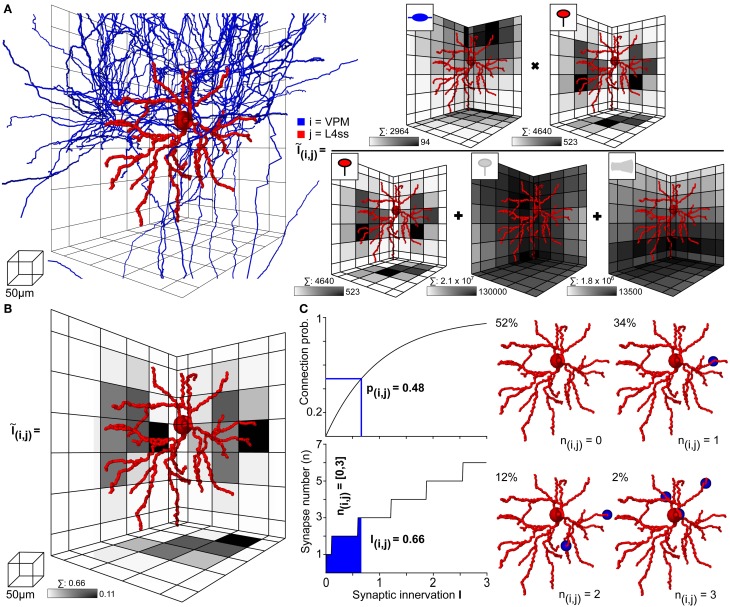
Figure 4.
Computation of statistical innervation between neurons in dense networks. (A) Left: VPM axon (blue) and L4ss dendrite (red) from Figures 3C–E. The grid used for computing bouton, spine and dendrite surface densities is shown for scale. Right: Calculation of the 3D innervation density Ĩij() from the VPM axon to the L4ss dendrite. The gray-colored squares in the grid represent the maximum projection of the respective pre/postsynaptic quantity. Scale bar shows maximum value of the respective pre/postsynaptic quantity in the grid. Above each scale bar, the total number of pre/postsynaptic elements in the grid is shown. (B) Resulting subcellular 3D innervation density Ĩij(). (C) Left top: Connection probability from neuron i to neuron j as a function of the total innervation Iij. Bottom: Possible range of the number of synapses from neuron i to neuron j, nij (95th percentile for n > 0) as a function of the total innervation Iij. Right: Four possible synapse distributions and their probability of occurrence for the innervation from the VPM axon to the L4ss dendrite, computed from the 3D innervation density in (B).

