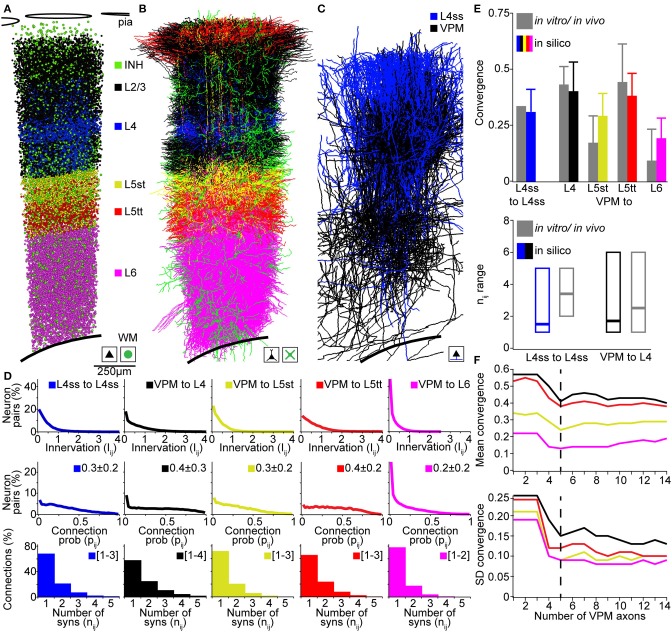
Figure 5.
Validation of the rat vibrissal cortex statistical connectome. (A) Cell type-specific distribution of neuron somata in the model D2 column. (B) Cell type-specific distribution of dendrites in the model D2 column from (A). Note that large basal dendrites of L3 pyramidal neurons located in the septum around the L4 barrel obscure dendrites of L4ss located inside the barrel. (C) Distribution of L4ss axons (blue) and VPM axons (black) in the model D2 column from (A). (D) Distribution of neuron-to-neuron innervation Iij, the neuron-to-neuron connection probability pij and the average distribution of the number of synapses per connection nij for the four postsynaptic cell types in (B) and the two presynaptic cell types in (C). (E) Comparison of pair-wise connectivity statistics in the model D2 column (in silico) and experimental results from physiological and anatomical measurements in vitro and in vivo. Top: convergence of intra-barrel connectivity and thalamocortical connectivity from VPM. Bottom: Observed and calculated range of number of synapses per connection (in silico: 99% cumulative range of the average distribution of nij). (F) Effect of the size of the sparse morphological sample on connectivity measurements. Top: Mean convergence of thalamocortical input from VPM to four cell types in the model D2 column (see E for color-code) as a function of the VPM axon sample size. Bottom: Standard deviation of the convergence of thalamocortical input to these four cell types as a function of the VPM axon sample size.

