
Figure 1.
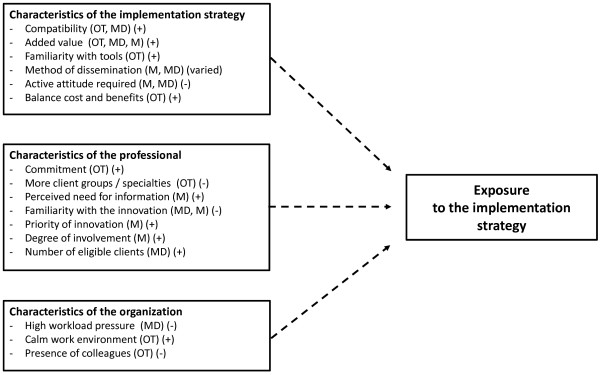
Graphical overview of factors influencing the exposure of professionals to the implementation strategy as identified through qualitative methods. + = positive influence on exposure; - = negative influence on exposure; Varied = direction of influence varied per individual; OT = occupational therapist; MD = physician; M = manager; qualitative data  .
.