
Figure 3.
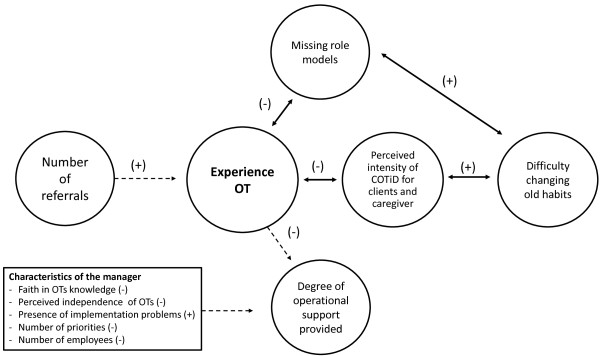
Graphical overview of the role of experience in the implementation process and factors affecting the (self-perceived) experience. (+) = positive relationship; (-) = inverse relationship; quantitative data  ; qualitative data
  .
.
Official websites use .gov
A
.gov website belongs to an official
government organization in the United States.
Secure .gov websites use HTTPS
A lock (
) or https:// means you've safely
connected to the .gov website. Share sensitive
information only on official, secure websites.
Graphical overview of the role of experience in the implementation process and factors affecting the (self-perceived) experience. (+) = positive relationship; (-) = inverse relationship; quantitative data ; qualitative data .