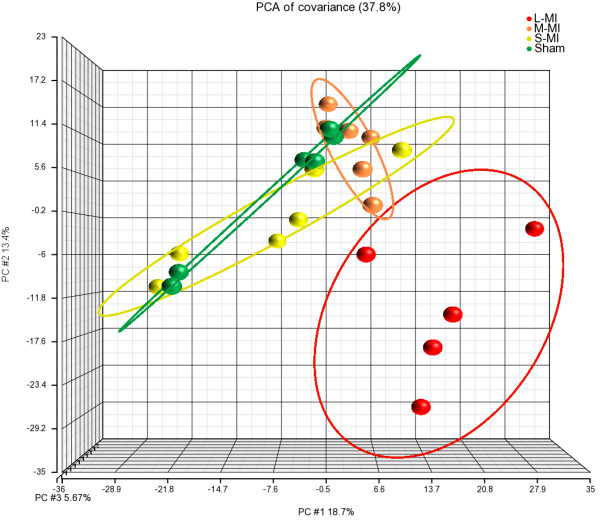
Figure 1.

Principal component analysis of left ventricular gene expression profiles. PCA plot shows the first three principal components of microarray data in respect to their correlation. Sham - sham-operated; S-MI - small-size infarction; M-MI - moderate-size infarction; L-MI - large-size infarction.
