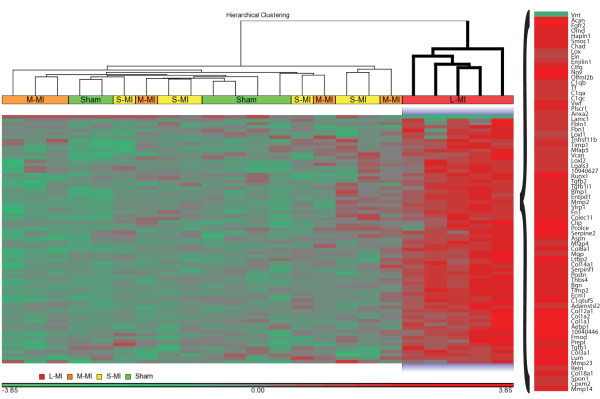
Figure 3.

Heat map representing hierarchical clustering of 73 differentially expressed genes related to extracellular matrix (GO:0031012). Each column corresponds to a single microarray whereas each row represents expression profile of a single gene. Red stand for the positive values in the gene expression and green for the negative ones. Sham - sham-operated; S-MI - small-size infarction; M-MI - moderate-size infarction; L-MI - large-size infarction.
