
Figure 4.
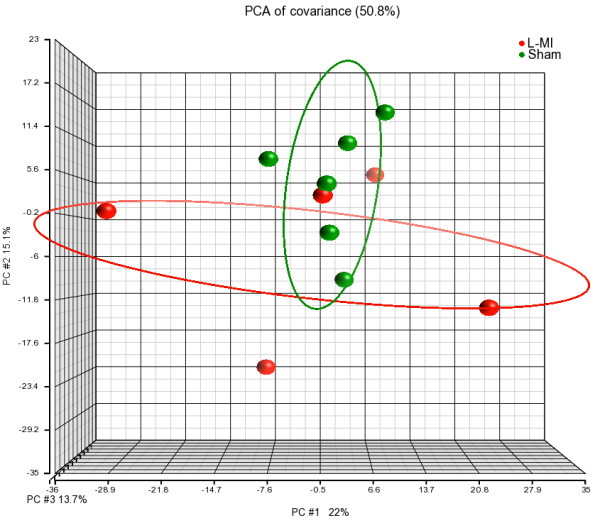
Principal component analysis of PBMCs gene expression profiles. PCA plot shows the first three principal components of microarray data in respect to their correlation. Sham - sham-operated; L-MI - large-size infarction.
Official websites use .gov
A
.gov website belongs to an official
government organization in the United States.
Secure .gov websites use HTTPS
A lock (
) or https:// means you've safely
connected to the .gov website. Share sensitive
information only on official, secure websites.
Principal component analysis of PBMCs gene expression profiles. PCA plot shows the first three principal components of microarray data in respect to their correlation. Sham - sham-operated; L-MI - large-size infarction.