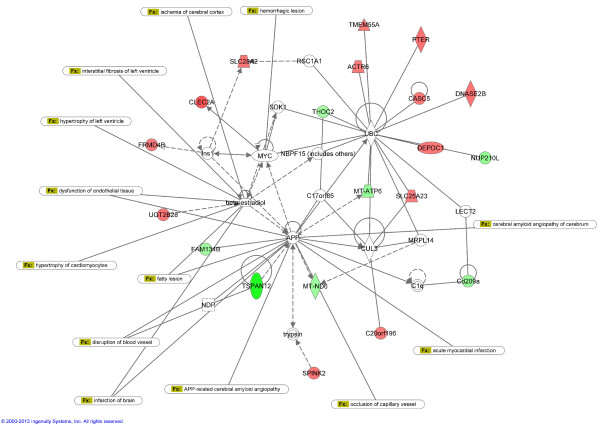
Figure 5.

Highest scoring interaction network generated by Ingenuity Pathway Analysis for genes differentially expressed in PBMCs. The top network classified as “Cardiovascular System Development and Function, Cellular Function and Maintenance, Cellular Growth and Proliferation” is overlaid for cardiovascular diseases. Genes or gene products are represented as nodes, and the biological relationship between two nodes is represented as a line. Continuous lines indicate direct interactions, while dashed lines indicate indirect relationships. Upregulated and downregulated genes are shown in red and green shading respectively, with colour intensity related to the fold change in expression. White symbols indicate molecules absent in the analysed dataset but related with the dataset genes.
