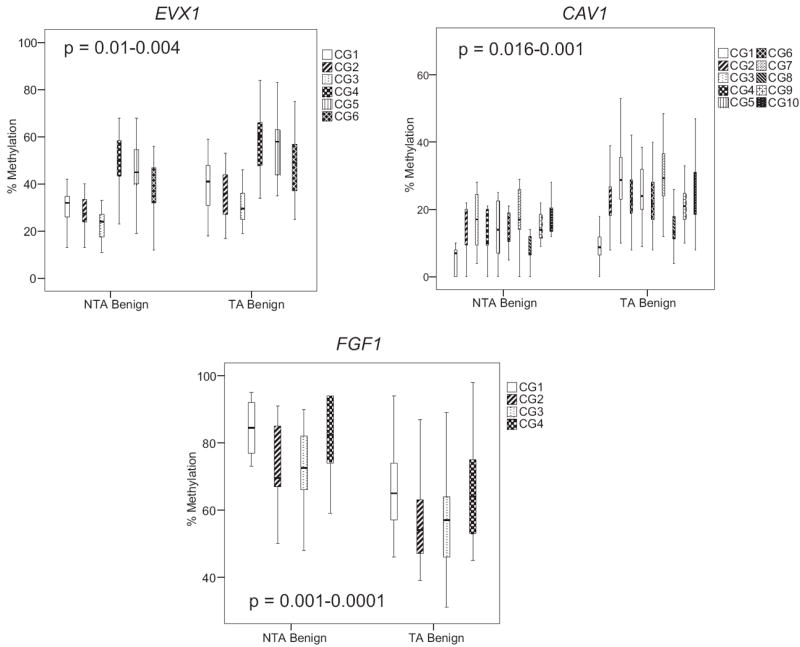
Figure 2.

Quantitative Pyrosequencing revealed NTA and TA tissue EVX1, CAV1 and FGF1 methylation levels. EVX1 and CAV1 were hypermethylated in TA compared to NTA tissue. FGF1 was hypomethylated gene in TA tissue. All p values were highly statistically significant at all CpG sites (see supplementary table, http://jurology.com/). In all experiments SssI methylase treated, bisulfite converted DNA from HPEC and PPC1 cells served as positive controls. Water was substituted for DNA as negative control. Boxes represent 75th and 25th percentiles. Whiskers represent minimum and maximum. Bold lines represent median.
