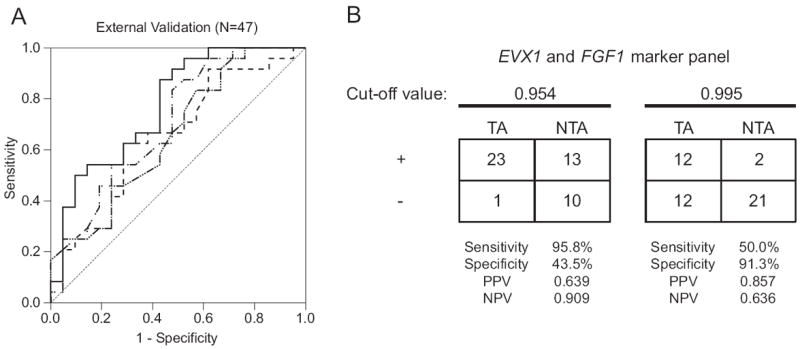
Figure 3.

A, ROC curves were generated to externally validate predictive accuracy of uniplex and multiplex regression models for discriminating TA and NTA biopsy negative cores. When used alone, EVX1 (dashed and dotted curve), CAV1 (dashed curve with multiple dots) and FGF1 (dashed curve) discriminated between patients with and without known cancer (AUC 0.702, 0.696 and 0.658, respectively, p <0.05). Multiplex model incorporating EVX1 and FGF1 (solid curve) had highest predictive accuracy (AUC 0.774, 95% CI 0.64-0.908, p = 0.001) for discriminating TA vs NTA benign cores (47) from transrectal ultrasound guided biopsy. B, EVX1 and FGF1 multiplex model sensitivity, specificity, positive predictive value (PPV) and NPV. Two optimal cutoffs for predicted probabilities were used to define positive (+) and negative (−) test results.
