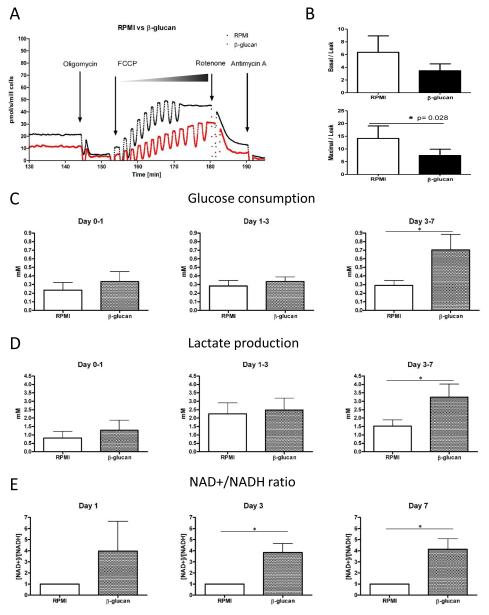
Figure 2. Post β-glucan Treatment Physiology.
(A) The representative oxygen consumption rate of RPMI and β-glucan trained monocytes determined by high-resolution respirometry (Oxygraph) (B) Baseline (upper panel) and maximum oxygen consumption rate (lower panel)of untrained (open bar) and β-glucan-trained (closed bar) monocytes determined by respirometry and normalized to the leak oxygen consumption. Kinetic changes of (C) glucose consumption and (D) lactate production from day 1, day 3 and day 7 of the RPMI and β-glucan trained monocytes. (E) The kinetics of NAD+/NADH determined at day 1, day 3 and day 7.

