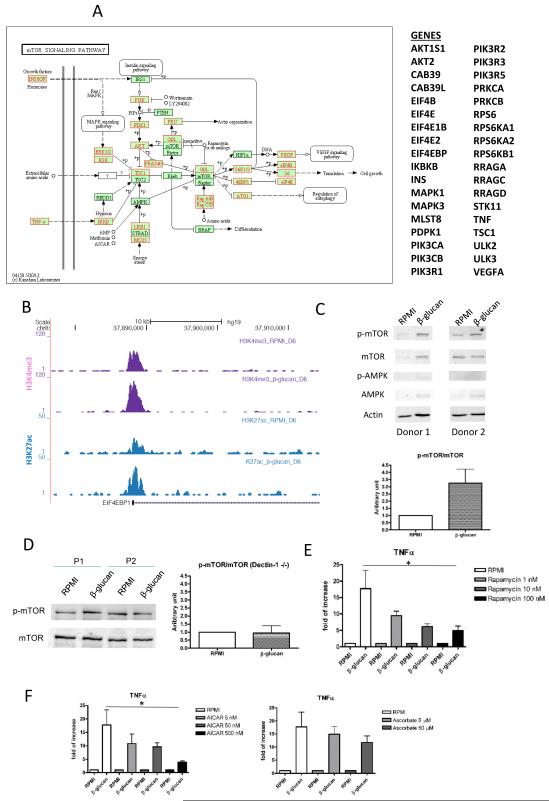
Figure 3. mTOR Signaling in β-glucan Treated Monocytes.
(A) Schematic representation of the upregulated enzymes (red) in mTOR signaling pathway. (B) Screenshot of the H3K4me3 (blue) and H3K27Ac (purple) modification in the promoter region of EIF4eBP, the main target of mTOR. (C) Western blot from cell lysate harvest at day 7 for endogenous phospho-mTOR, total mTOR, phospho-AMPK, AMPK and actin. p-mTOR/mTOR ratio is shown as a bar chart. (D) The endogenous p-mTOR status of Dectin-1 deficient patients and healthy control by Western blot from cell lysate harvest at day 7. p-mTOR/mTOR ratio is shown as a bar chart. The relative cytokine production was determined from the cells incubated with (E) rapamycin (mTOR inhibitor), (F) AICAR (AMPK inhibitor) and ascorbate (HIF1α inhibitor) in a dose-dependent manner.

