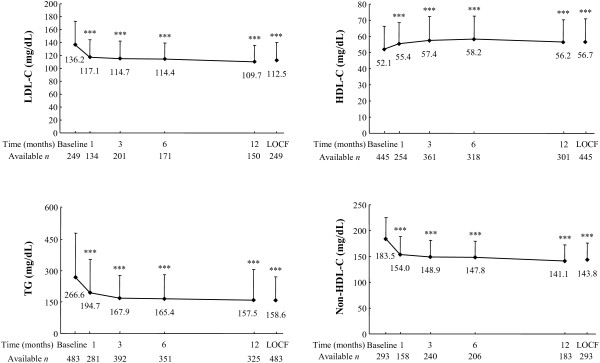
Figure 1.

Changes in LDL-C, HDL-C, TG, and non-HDL-C levels from baseline to the LOCF. Data are expressed as mean ± standard deviation. The paired t test was used to examine the significance of within-group changes from baseline to the last observation carried forward (LOCF). *** p < 0.001. LDL-C levels were estimated using the Friedewald formula.
