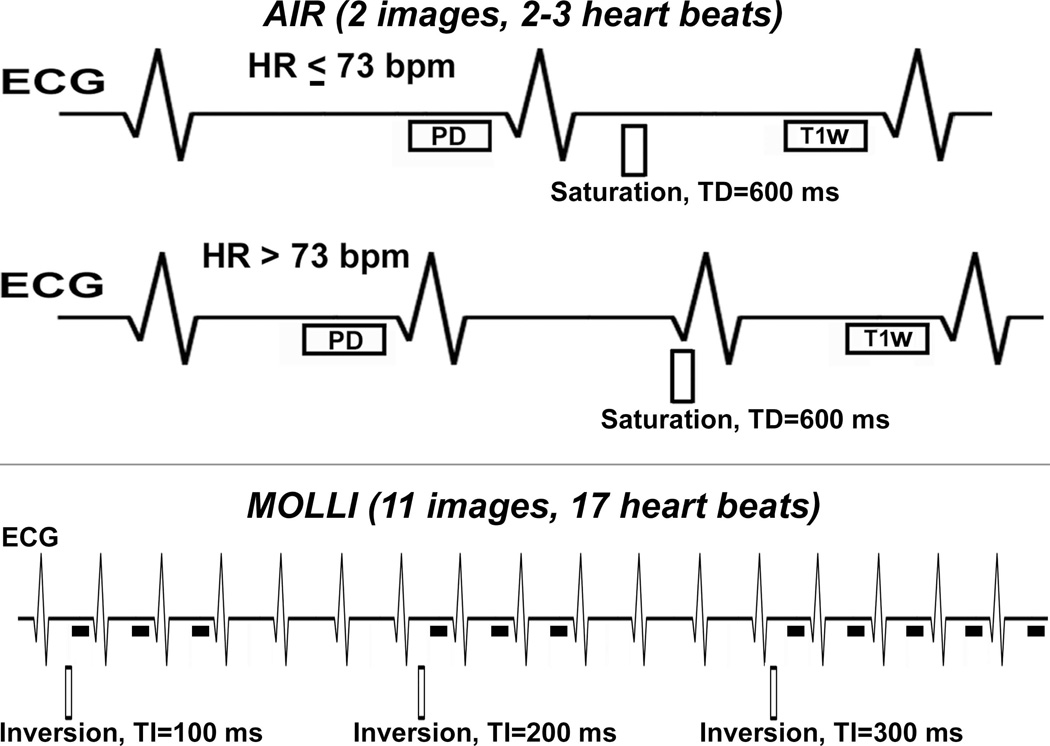
Figure 1.
Schematic of AIR (top row) and (bottom) MOLLI cardiac T1 mapping pulse sequences. AIR acquires one proton density and one T1-weighted image in succession with scan time of 2–3 heart beats, depending on heart rate as shown. MOLLI acquires 11 images with scan time of 17 heart beats, following three inversion pulses as shown (i.e., 3-3-5).

