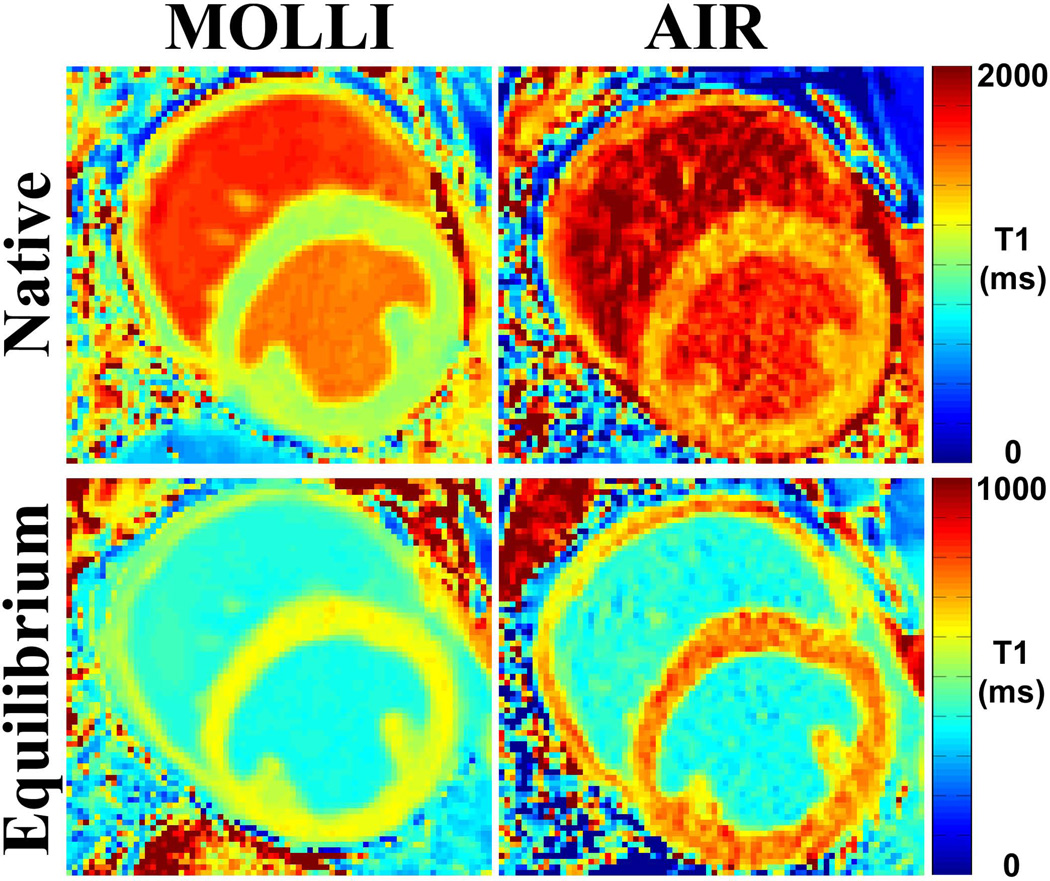
Figure 2.
Representative cardiac T1 maps of one dog (heart rate = 94.5 bpm) acquired with MOLLI (left) and AIR (right) cardiac T1 mapping pulse sequences: native (top row) and post-contrast (bottom row). These examples illustrate typical image quality produced by MOLLI and AIR. Compared with AIR T1 maps derived from only 2 images, MOLLI T1 maps derived from 11 images exhibited higher overall SNR. Native myocardial and blood T1 values were different (native myocardial T1 was 1074.1 ms (MOLLI) and 1373.4 ms (AIR); native blood T1 was 1492.7 ms (MOLLI) and 1692.9 ms (AIR). Post-contrast myocardial T1 was also different (605.5 ms [MOLLI] and 724.5 ms [AIR]), but post-contrast blood T1 was not different (389.2 ms [MOLLI] and 384.8 ms [AIR]). These differences in T1 resulted in discordant ECV measurements (22.0% and 18.8% for MOLLI and AIR, respectively).

