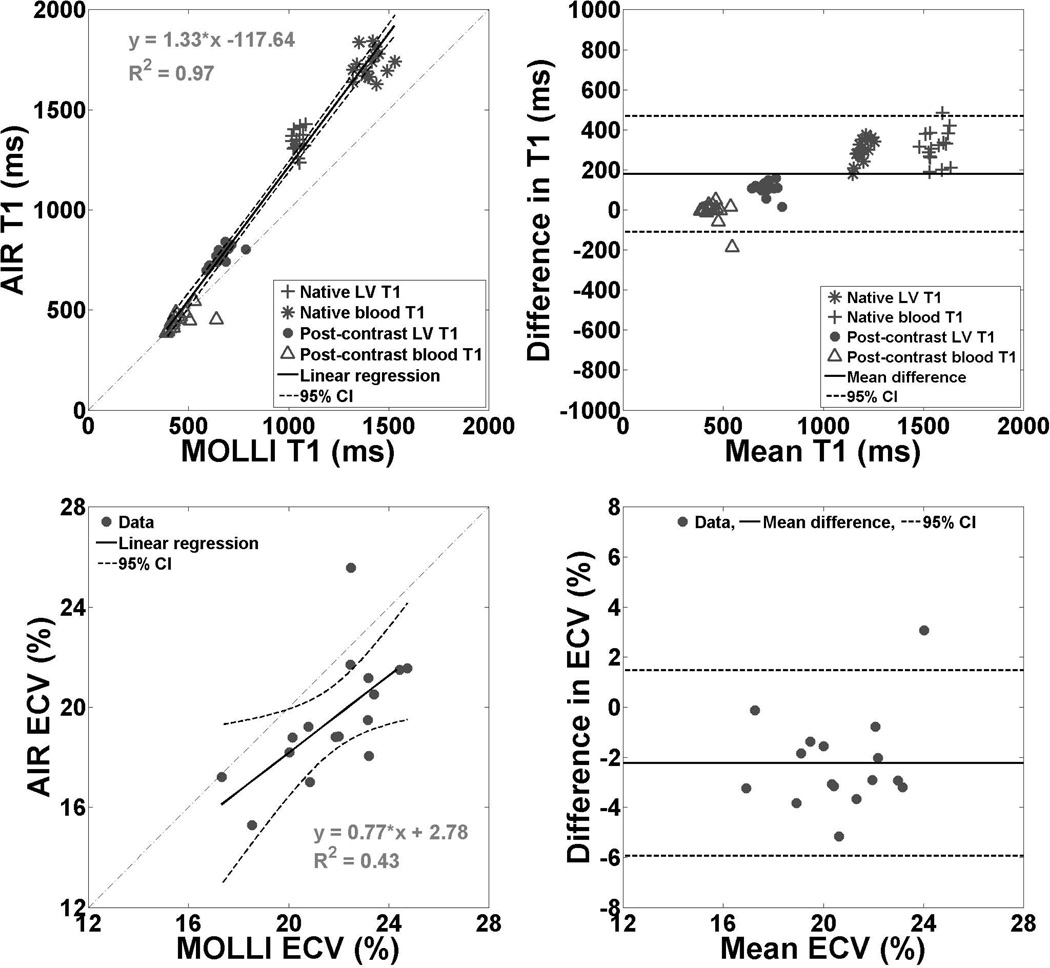
Figure 3.
Scatter plots representing linear regression (left column) and Bland-Altman (right column) analyses: T1 (top row) and ECV (bottom row) derived from MOLLI and AIR cardiac T1 mapping pulse sequences in 16 dogs. According to the linear regression and concordance correlation analyses, T1 values were strongly correlated (Pearson's correlation coefficient = 0.99, slope = 1.33, bias = −117.6 ms, p < 0.0001; concordance correlation coefficient = 0.87). According to the Bland-Altman analysis, the mean difference in T1 was 179 ms (± 95% confidential interval (CI) = 468/−109 ms), which corresponds to 18% of the mean T1 value (981 ms). For ease of interpretation, the Bland-Altman plot for T1 was displayed with y-axis ranging from −1000 to 1000 ms (i.e., approximately −100 to 100 % of the mean value of 981 ms). According to the linear regression analysis, ECV values derived were moderately correlated (Pearson's correlation coefficient = 0.65, slope = 0.77, bias = 2.8%, p < 0.001). According to the concordance correlation analysis, ECV values were weakly correlated (correlation coefficient = 0.43). According to the Bland-Altman analysis, the mean difference in ECV was −2.2% (± 95% CI = 1.5/−5.9%), which corresponds to 10.8% of the mean ECV value (20.7%). For ease of interpretation, the Bland-Altman plot for ECV was displayed with y-axis ranging from −8 to 8% (i.e., approximately −10 to 10 % of the mean value of 20.7%). Difference defined as AIR - MOLLI.

