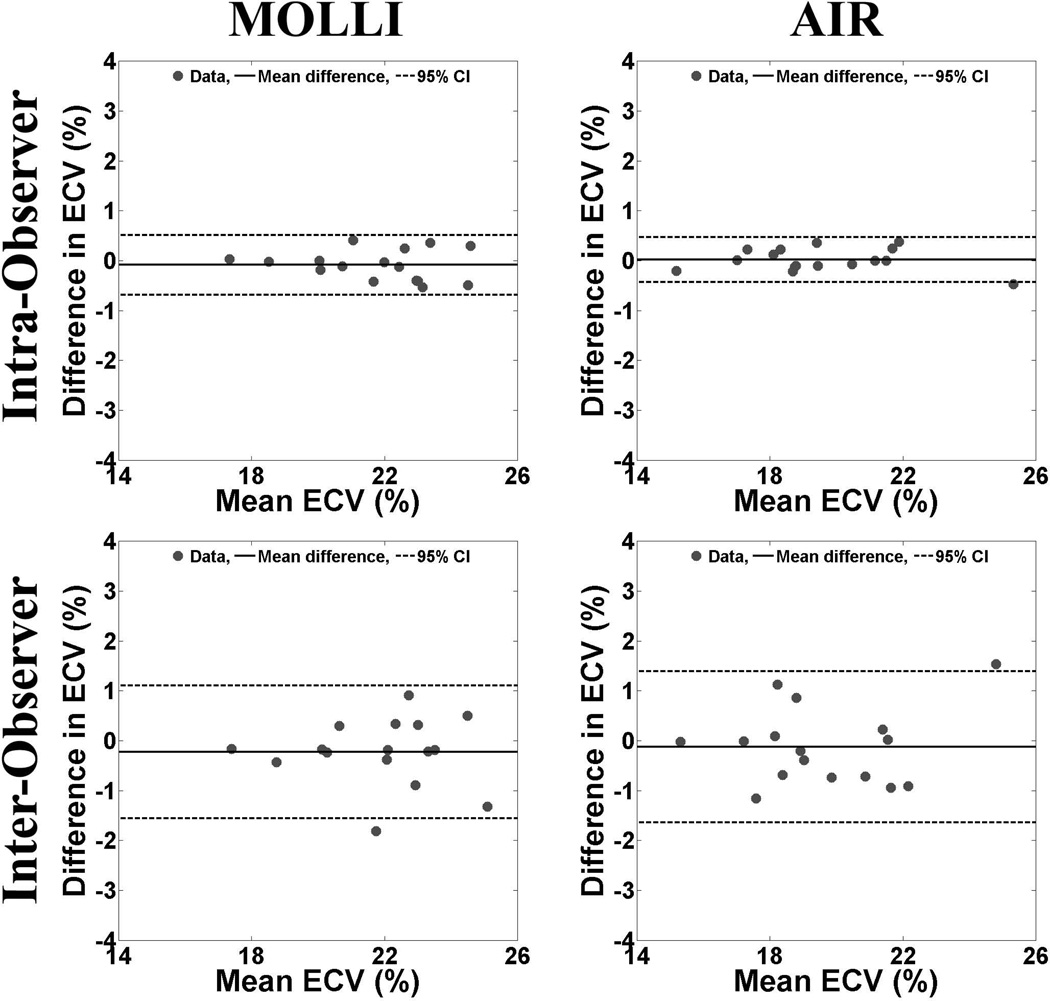
Figure 5.
Scatter plots representing the intra- (top row) and inter-observer (bottom row) agreements in calculation of ECV derived from MOLLI (left column) and AIR (right column) data sets. For intra-observer agreement, the mean difference in ECV was −0.09% (upper/lower 95% limits of agreement = 0.5/−0.7%) and 0.02% (upper/lower 95% limits of agreement = 0.5/−0.4%) for MOLLI and AIR, respectively. For inter-observer agreement, the mean difference in ECV was −0.2% (upper/lower 95% limits of agreement = 1.1/−1.6%) and −0.1% (upper/lower 95% limits of agreement = 1.4/−1.6%) for MOLLI and AIR, respectively. Note that CR was similar between MOLLI and AIR, possibly due to off-setting errors from multiple measurements. For ease of interpretation, the Bland-Altman plots were displayed with y-axis ranging from −4 to 4% (i.e., approximately −5 to 5 % of the mean value of 20%). Solid and dotted lines represent the mean difference and 95% confidence intervals, respectively.

