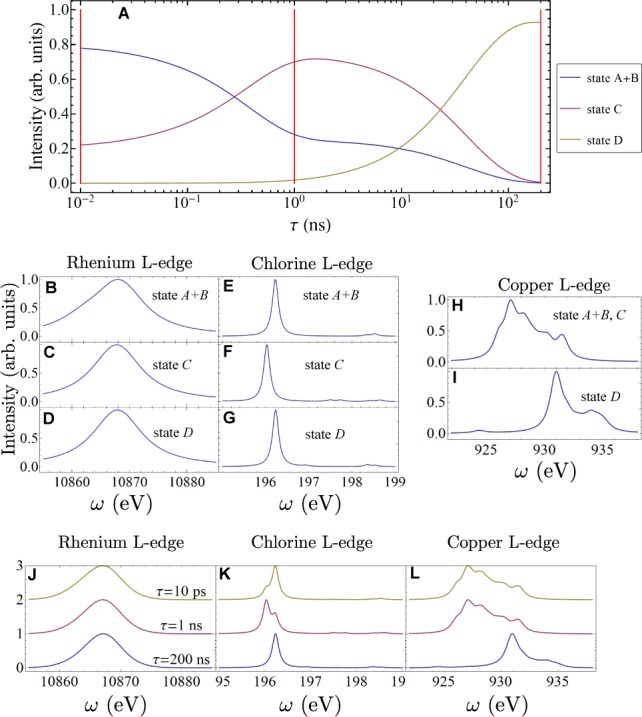
Figure 3.

Time-dependent populations and simulated X-ray absorption signals. See the spectroscopy signal calculation section of the Supporting Information for X-ray parameters. (A) Time-dependent populations for different states in the ET process calculated from eq 1 and with the initial conditions [A]0 = 0.8, [B]0 = 0.0, [C]0 = 0.2 and [D]0 = 0.0. See Figure 2 for explanations of different states. TXAS and SXRS signals are calculated at the three selected times marked with vertical red lines, at τ = 10 ps, 1 ns, and 200 ns. Middle panels: XANES spectra of different species. (B) Simulated Re L-edge XANES spectrum for state A+B. (C) Simulated Re L-edge XANES spectrum for state C. (D) Simulated Re L-edge XANES spectrum for state D. (E) Simulated Cl L-edge XANES spectrum for state A+B. (F) Simulated Cl L-edge XANES spectrum for state C. (G) Simulated Cl L-edge XANES spectrum for state D. (H) Simulated Cu L-edge XANES spectrum for state A+B and C. (I) Simulated Cu L-edge XANES spectrum for state D. Bottom panels: Time-dependent XANES. (J) TXAS of a 200 as pulse tuned to Re L-edge with interpulse delays set to 10 ps, 1 and 200 ns. (K) Same as (J), but the Cl L-edge TXAS signals are shown. (L) Same as (J), but the Cu L-edge TXAS signals are shown.
