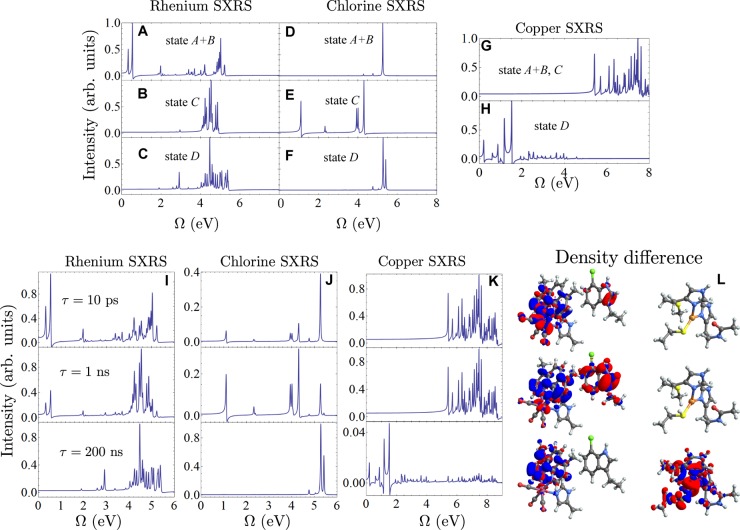
Figure 4.
Static and time-dependent SXRS signals. See the spectroscopy signal calculation section of the Supporting Information for X-ray parameters. (A) SXRS signal taken with 100 as pulses tuned to Re L-edge for state A+B. (B) Re L-edge SXRS signal for state C. (C) Re L-edge SXRS signal for state D. (D) Cl L-edge SXRS signal for state A+B. (E) Cl L-edge SXRS signal for state C. (F) Cl L-edge SXRS signal for state D. (G) Cu L-edge SXRS signal for state A+B and C. (H) Cu L-edge SXRS signal for state D. (I) Time-dependent Re L-edge SXRS signals for the three snapshots indicated in the figure. (J) Same as panel I, but for the Cl L-edge SXRS signals. (K) Same as panel I, but for the Cu L-edge SXRS signals. (L) Three snapshots, with the delay between the initiation and the Raman pulses set to 10 ps, 1 ns, and 200 ns from top to bottom, of the evolving electron density difference of the system (excited state density minus ground state density). Red denotes a negative sign (hole) and blue denotes a positive sign (electron). Rhenium is in pink, chlorine is in green, copper is in orange, nitrogen is in blue, oxygen is in red, carbon is in gray, and hydrogen is in white.

