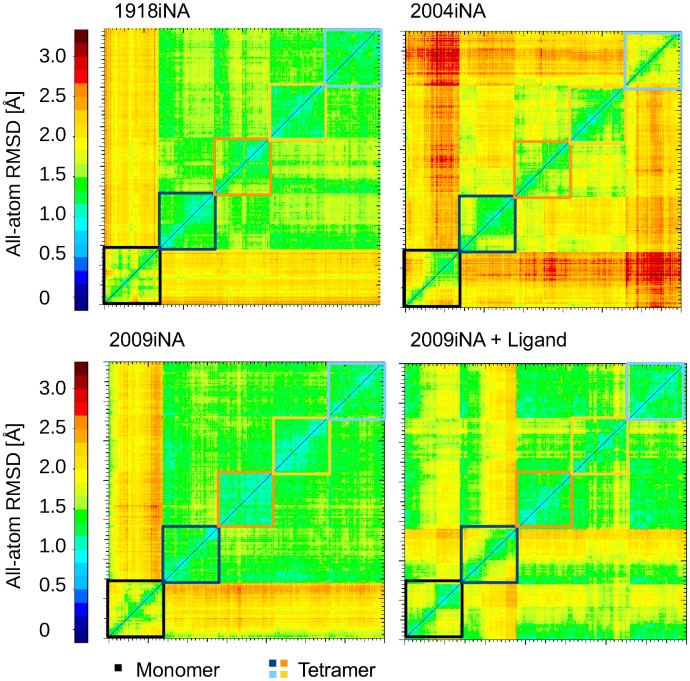
Figure 4.
Different conformations of the binding cavities are sampled in monomer and tetramer simulations of iNAs. The heat maps of all atom RMSDs are calculated for 61 residues as observed during simulations of the monomer and the tetramer. Blue and greenish colors within the subunits of tetramer simulations indicate constrained flexibility. For the region comparing the conformations from the different subunits, green and yellow areas indicate the sampling of similar conformational space. Orange and red areas highlight substantial differences in the conformational space sampled by monomers compared to their tetrameric counterparts.

