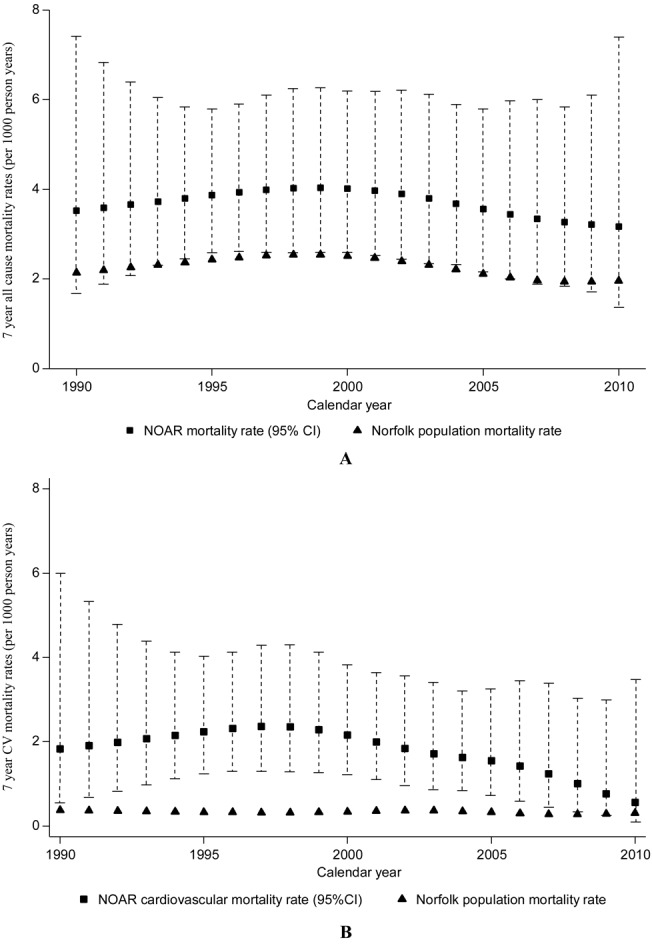
Figure 1.

Observed and expected mortality rates by calendar year for all-cause (A) and cardiovascular (CV)–specific (B) mortality. Observed rates were modeled using Poisson regression with natural splines and expected rates were calculated from mortality rates for Norfolk, age and sex standardized to the study population. The y-axes show rates per 1,000 person-years and 95% confidence intervals (95% CIs). NOAR = Norfolk Arthritis Register.
