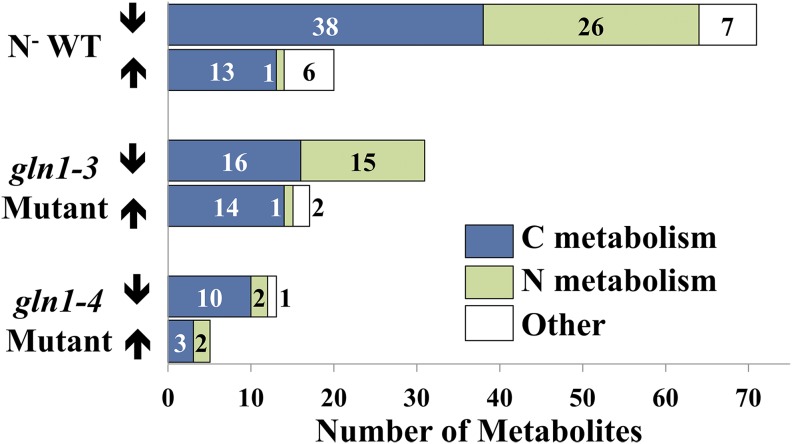
Figure 3.
Number of metabolites in each condition that statistically varied from the N+ WT condition at the vegetative stage. The numbers of metabolites that experimentally significantly increased (up arrows) or decreased (down arrows) in comparison with the N+ WT condition are displayed for each of the N conditions tested (i.e. N− WT, gln1-3 mutant, and gln1-4 mutant conditions). The metabolites are shaded based on whether they are involved in carbon (C), N, or other metabolism. [See online article for color version of this figure.]

