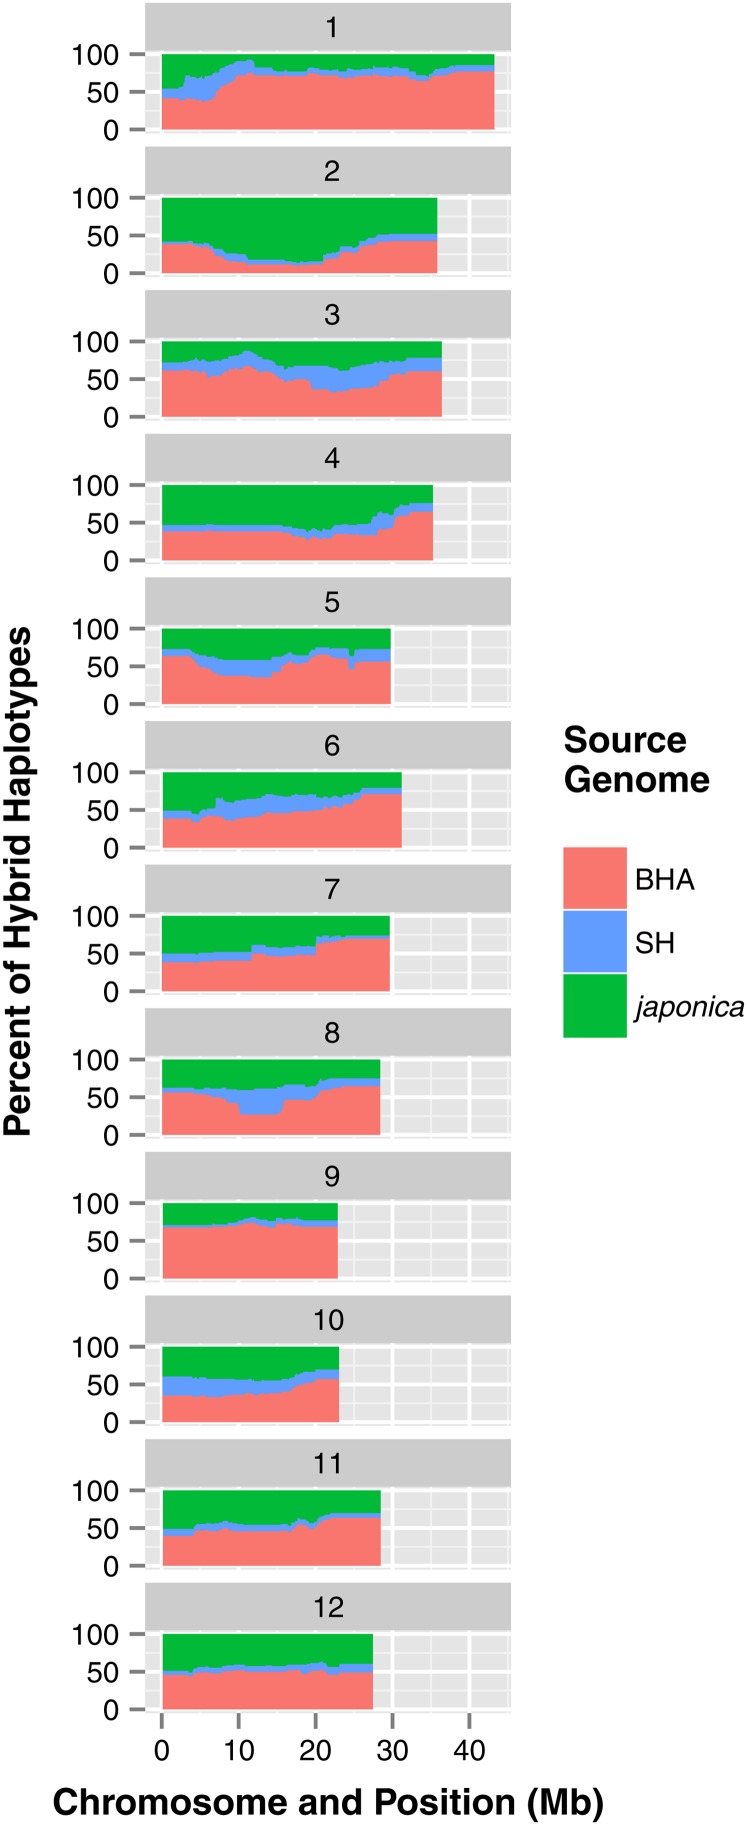
Figure 7.
Distribution of parental population contribution to the HR weedy rice population as determined by LAMP-LD. Each horizontal bar represents a single chromosome. Colors denote possible parental populations. For all SNPs included in the analysis, the percentage of haplotypes carrying alleles from each parental population is shown.

