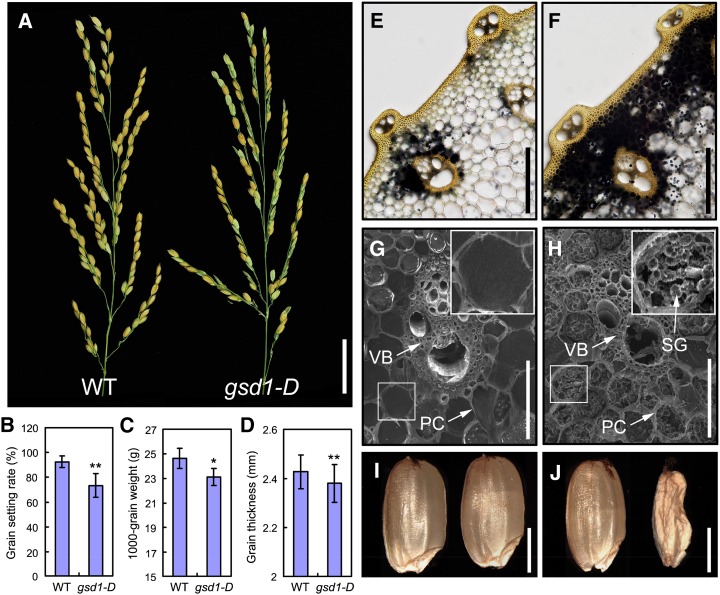
Figure 1.
Phenotypic comparison between the wild type and the homozygous gsd1-D mutant. A, Comparison of the wild type (left) and gsd1-D mutant panicles (right) at the grain-ripening stage. B to D, Comparison of the grain setting rate (B), 1,000-grain weight (C), and grain thickness (D) between the wild type and the gsd1-D mutant. Error bars show the means ± se (Student’s t test, n = 15 in B, n = 10 in C, and n = 25 in D). The single asterisk represents P < 0.05, and double asterisks represent P < 0.01. E and F, Iodine-potassium iodide (I2-KI) staining of starch at the second internode of the wild type (E) and gsd1-D (F) in the grain matured plants. G and H, Scanning electron microscopy observation of the second internode sections of the wild type (G) and gsd1-D (H) in the grain matured plants. I and J, Mature seeds from the wild type (I) and the gsd1-D mutant (J). PC, Parenchyma cell; SG, starch granule; VB, vascular bundle; WT, wild type. Bars = 3 cm in A; 200 μm in E and F; 50 μm in G and H; and 2 mm in I and J.

