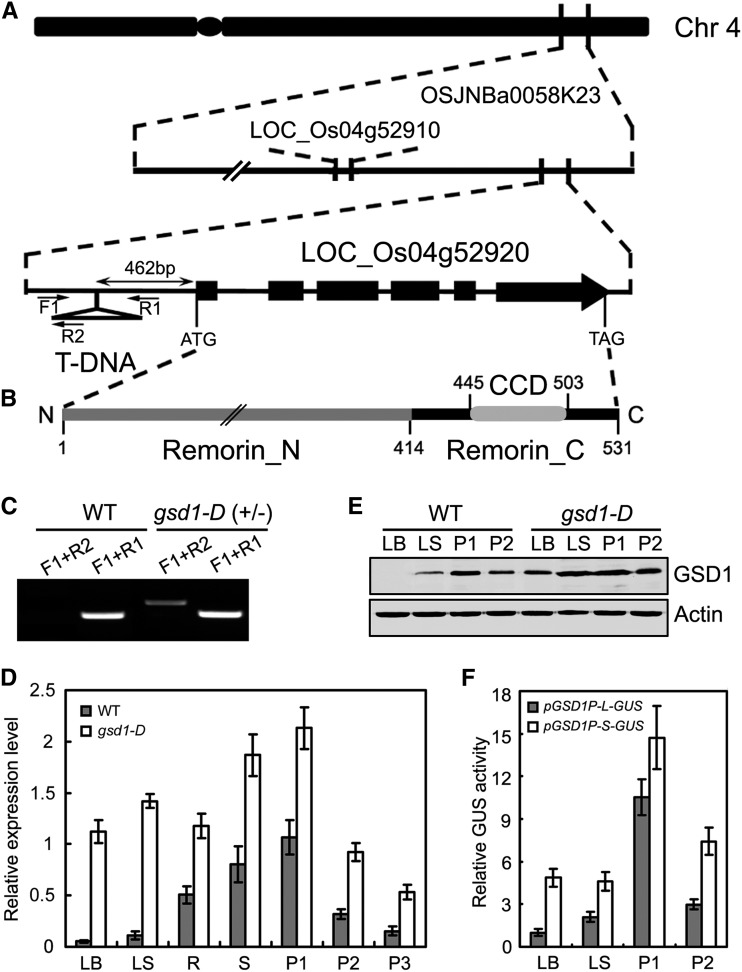
Figure 3.
Molecular cloning and expression of GSD1. A, Diagram of the GSD1 (Os04g52920) gene located on chromosome 4 and the T-DNA insertion position. Exons are shown as black boxes. In the gsd1-D mutant, T-DNA is inserted at the 462 bp upstream of ATG. Primers used in the genotype analysis are indicated by black arrows. F1 and R1 are gene-specific primers, and R2 is a T-DNA-specific primer. B, Diagram of the GSD1 protein domains. Numbers indicate positions of amino acids. C, T-DNA insertion confirmation and genotype analysis. D, Quantitative reverse transcription (RT)-PCR analysis of GSD1 expression in various tissues of the wild type and the gsd1-D mutant. The rice actin1 gene was used as a reference for normalization. Results are means ± se of three individual samples. E, Comparison of GSD1 protein abundance in the leaf blade, leaf sheath, P1, and P2 between the wild type and the gsd1-D mutant. Actin is used as a loading control. The leaf blade and leaf sheath were collected from 2-month-old rice. F, Comparison of GUS activity between pGSD1-L-GUS and pGSD1-S-GUS. The results are means ± se of three biological independent samples. CCD, Coiled-coil domain; Chr, chromosome; LB, leaf blade; LS, leaf sheath; P1, booting panicle (7 d before flowering); P2, grain-filling panicle (5 DAF); P3, grain-filling panicle (10 DAF); R, root; Remorin_C, C-terminal residue; Remorin_N, N-terminal residues; S, stem.

