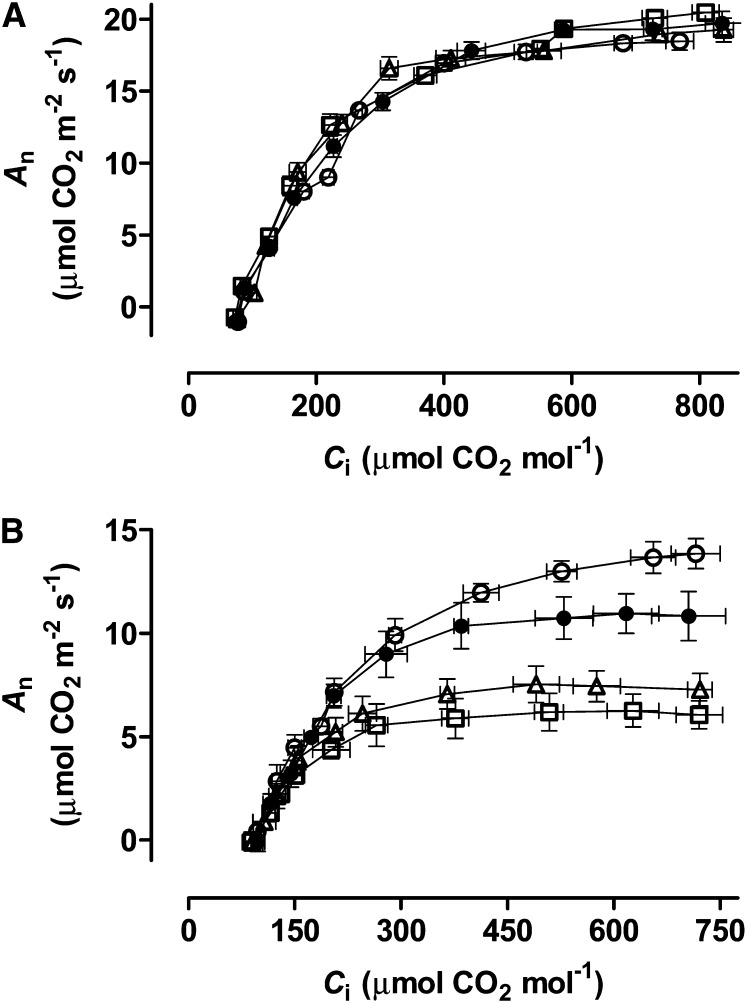
Figure 2.
CO2 response curves (An as a function of Ci) of wild-type N. tabacum (black circles) and three transgenic lines (B7, white circle; RI9, white triangle; and RI29, white square) with altered AOX amount, in both well-watered plants (A) and moderate drought-stressed plants (B). Data are the mean ± se of three independent experiments.

