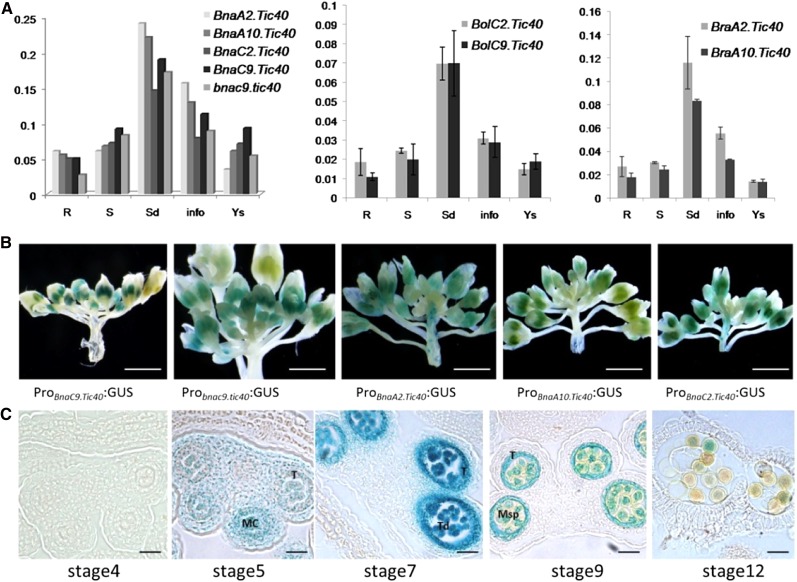
Figure 5.
Expression patterns of Brassica spp. Tic40 genes. A, Spatial and temporal expression analyses of Brassica spp. Tic40 genes in selected tissues using real-time PCR. R, Root; S, stem; Sd, seedling; info, inflorescence; Ys, young silique. Expression patterns of Brassica spp. Tic40 genes are shown for B. napus (left), B. oleracea (middle), and B. rapa (right). B, Histochemical analysis of the GUS activities (blue staining) directed by individual B. napus Tic40 promoters in transgenic A. thaliana plants. GUS expression was driven by the five promoters of BnaC9.Tic40, bnac9.tic40, BnaA2.Tic40, BnaA10.Tic40, and BnaC2.Tic40. At least three independent transgenic plants for each construct displayed similar GUS activities in the anthers of young buds, one of which is shown in each image. C, GUS expression patterns in the anthers of the B. napus Tic40 promoter-GUS transgenic line. Transgenic lines of the five B. napus Tic40 promoters displayed similar GUS staining patterns; thus, only anther sections of one Probnac9.tic40-GUS transgenic line is shown. The developmental stages of anthers were described according to the previous report by Ma (2005). GUS staining signals were obviously detectable in the tapetum, tetrads, and microspores during anther development. MC, Microsporocyte; Msp, microspore; T, tapetum; Td, tetrad. Bars = 5 mm in B and 100 μm in C.

