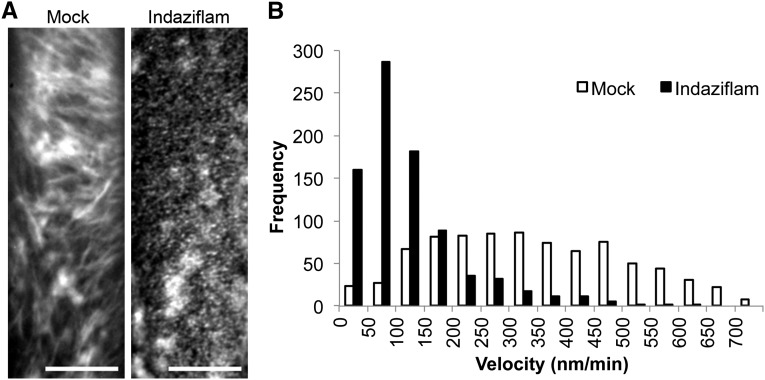
Figure 5.
Indaziflam reduced the velocity (particle movement rate) of YFP:CESA6. A, Representative time-lapse images of YFP:CESA6 particles in the prc1-1 background with and without indaziflam treatment (61 frames averaged). B, The histogram depicts the frequency of YFP:CESA6 particle velocities at the PM focal plane after a 2-h treatment with indaziflam or DMSO mock. Velocity was determined from images taken in the epidermal cells of 3-d-old dark-grown hypocotyls. The white bars are the recorded velocity from the mock and the black bars are indaziflam treatment (mean ±1 se). Bar = 10 μm

