Figure 1.
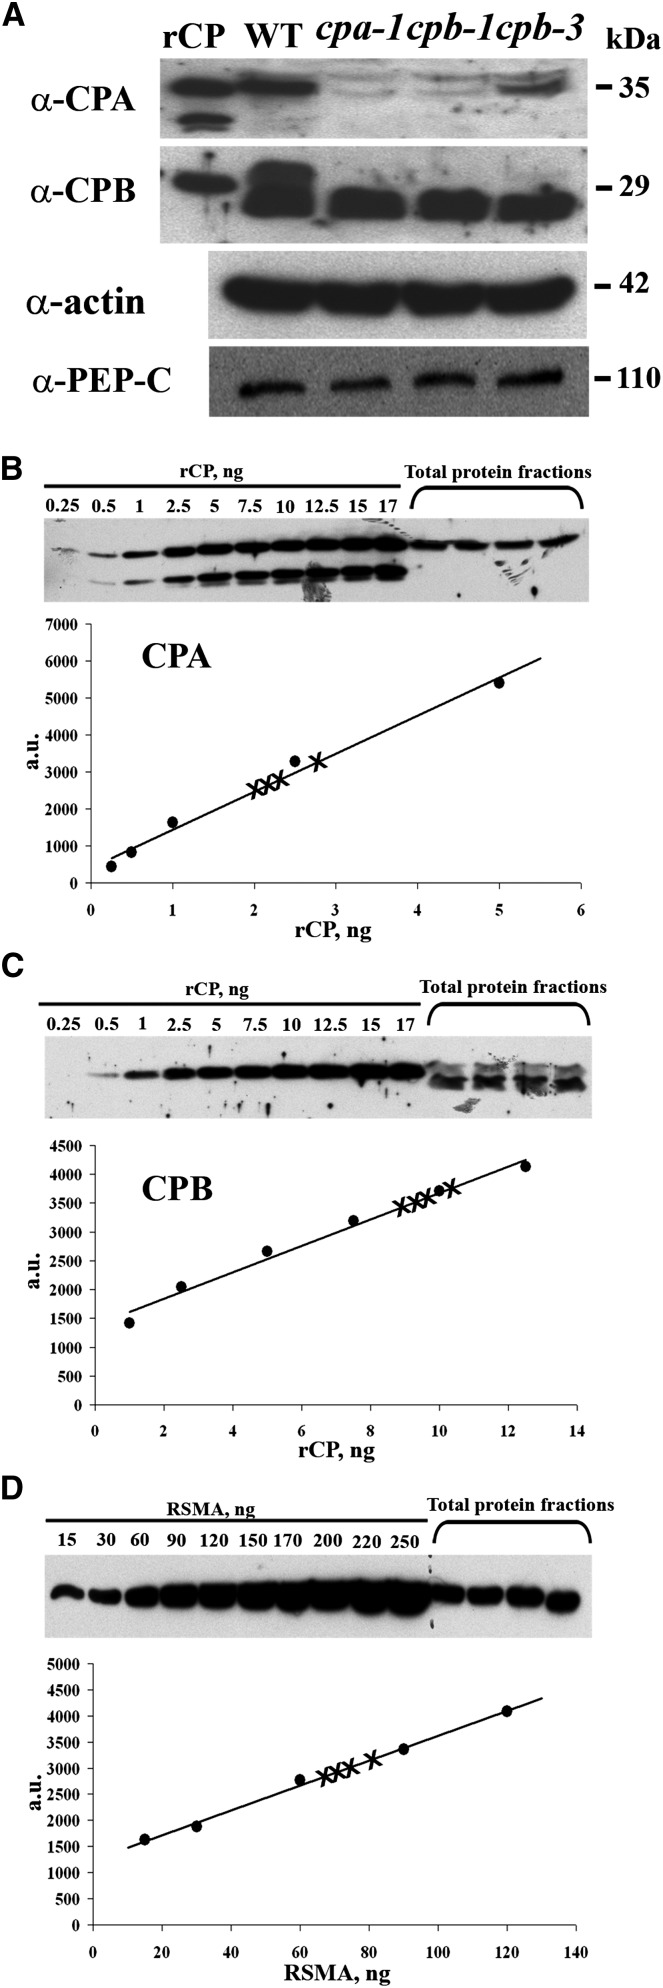
CP is a moderately abundant protein in total cellular extracts. A, On protein immunoblots, CPA and CPB antisera recognized polypeptides from purified rCP (10-ng load), as well as polypeptides of appropriate size from total cellular extracts of wild-type Arabidopsis Col-0 seedlings (50-µg load). Total cellular extracts (50 µg each) prepared from three homozygous T-DNA insertion mutant lines (cpa-1, cpb-1, and cpb-3; Li et al., 2012) had reduced levels of CPA and CPB polypeptides. Probing of identical membranes with anti-actin antibodies revealed that total actin levels were not reduced in the cp homozygous mutant lines compared with the wild type. The same blot was reprobed with anti-phosphoenolpyruvate carboxylase antibody, which recognized a band of 110 kD, and verifies the equal loading of samples. B and C, CPA and CPB protein levels were estimated by semiquantitative immunoblotting using total protein extracts from wild-type Arabidopsis seedlings and a standard curve comprising varying amounts of rCP. The Coomassie-stained gel images at the top show results from the blotting of a standard curve and four biological replicates of seedling extracts (75 µg each) with anti-CPA (B) and anti-CPB (C). The intensity of each band from the standard curve as a function of protein amount is plotted. The data were fit with a linear function and the correlation coefficients for these representative examples were 0.99 and 0.98 for CPA and CPB, respectively. In this example, CPA represents 0.0015% ± 0.0001% of total cellular protein, whereas CPB represents 0.0013% ± 0.0002%. D, Total actin levels were estimated by immunoblotting of seedling extracts prepared from the wild type and a standard curve comprising different amounts of purified rabbit skeletal muscle actin. The gel image shows the result from blotting of a standard curve and four biological replicates of seedling extracts (25 µg each). The intensity of each band from the standard curve as a function of protein amount is plotted. The data were fit with a linear function and the correlation coefficient for this representative example was 0.99. In this experiment, actin represents 0.37% ± 0.02% of total cellular protein. a.u., Arbitrary units; RSMA, rabbit skeletal muscle actin; WT, wild type.

