Figure 3.
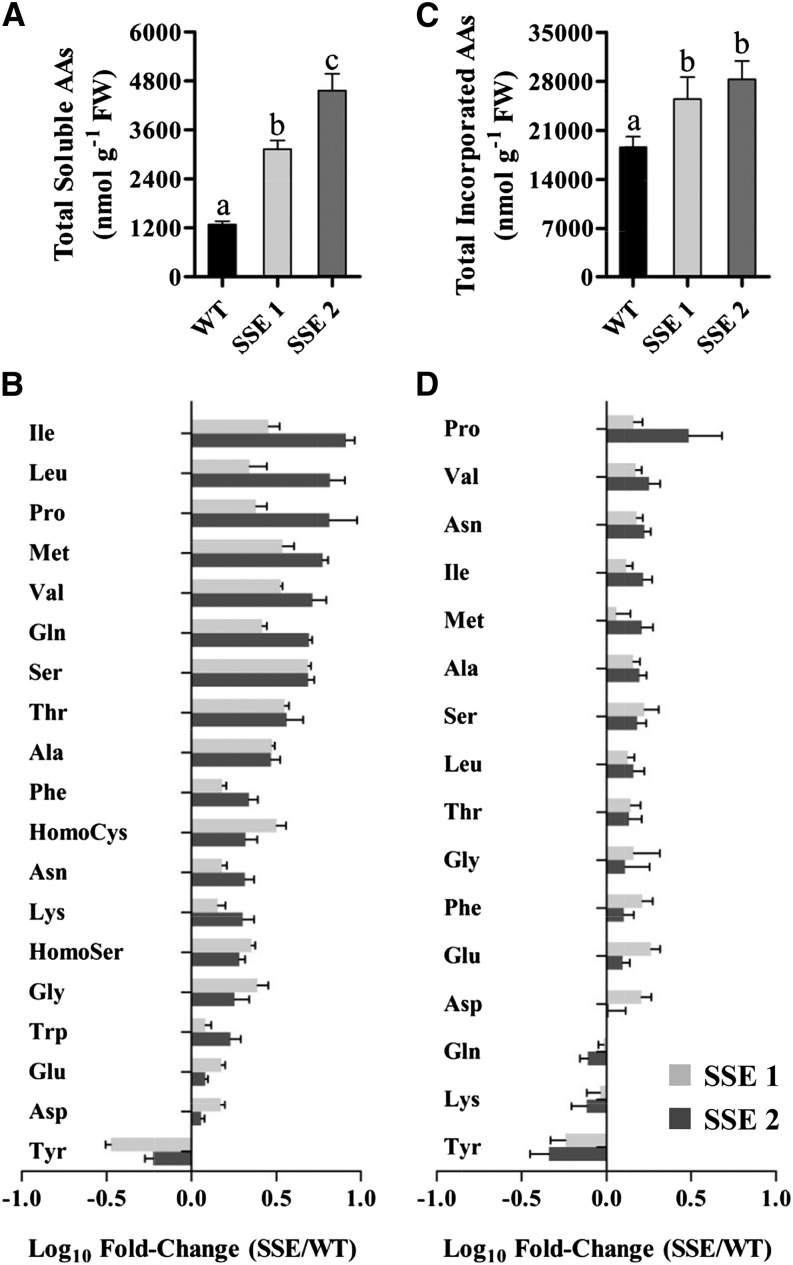
GC-MS-based analysis of soluble and protein-incorporated amino acids. A, Total soluble amino acid contents in mature dry seeds (fresh weight [FW]) of wild-type (WT) and SSE genotypes. B, Changes in the contents of individual soluble amino acids in mature dry seeds of both SSE genotypes. Data shown in A and B are means ± se of five replicates. C, Total protein-incorporated amino acid contents in mature dry seeds (fresh weight) of wild-type and SSE genotypes following protein hydrolysis. D, Changes in the contents of individual protein-incorporated amino acids in mature dry seeds of both SSE genotypes. Data shown in C and D are means ± se of eight replicates. Significance was calculated using the two-way ANOVA test of P < 0.05 and identified by different letters. The bars in B and D represent the log10-fold change in amino acid content in seeds from both SSE genotypes compared to wild-type seeds. The bars at right (positive) indicate increased content, and the bars on the left (negative) indicate decreased content.

