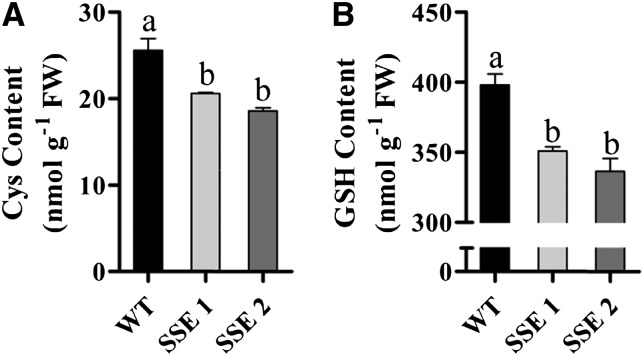
Figure 4.
HPLC analysis of Cys and GSH contents in mature dry seeds. A, Total Cys contents (fresh weight [FW]) of wild-type (WT) and SSE genotypes. B, Total GSH contents (fresh weight) of wild-type and SSE genotypes. Data shown are means ± se of four replicates. Significance was calculated using the two-way ANOVA test of P < 0.05 and identified by different letters.

