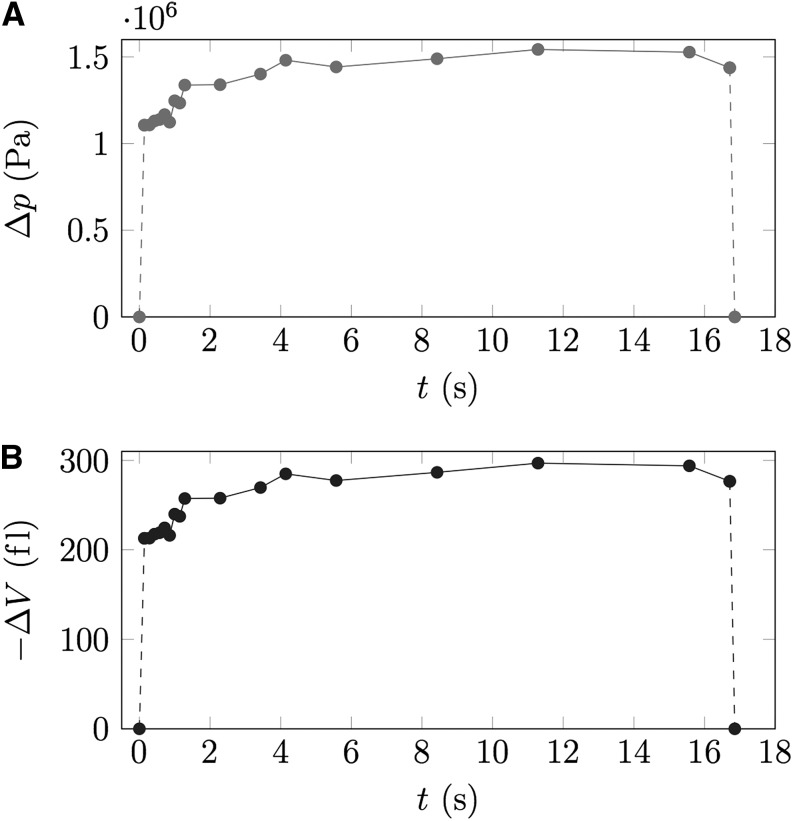
Figure 5.
Extraction of membrane permeability from pico gauge measurements. Nineteen individual frames over the course of 17 s were extracted from Supplemental Movie S5, and the turgor recovery curve (Δp; A) as well as the volumetric change (−ΔV; B) were plotted versus time. Since cell volume, cell surface area, and volumetric change over time can be measured, the membrane permeability can be extracted from the data.

