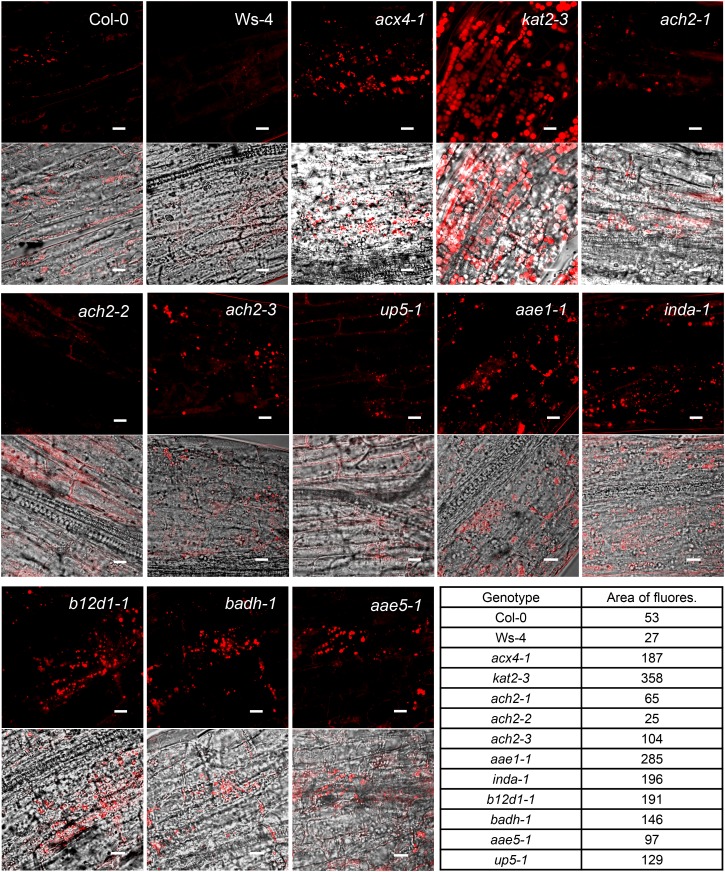
Figure 6.
Confocal microscopic visualization of oil bodies in the hypocotyl of 7-d etiolated seedlings. Seedlings were grown on 0.8% (w/v) agar plate. Nile Red fluorescence images (top) and merged images (bottom) of bright-field and Nile Red fluorescence are shown. Area of fluorescence is the arbitrary value (assigned by Image J) within the 75-µm2 area of the Nile Red fluorescent images shown. Bars = 10 µm.

