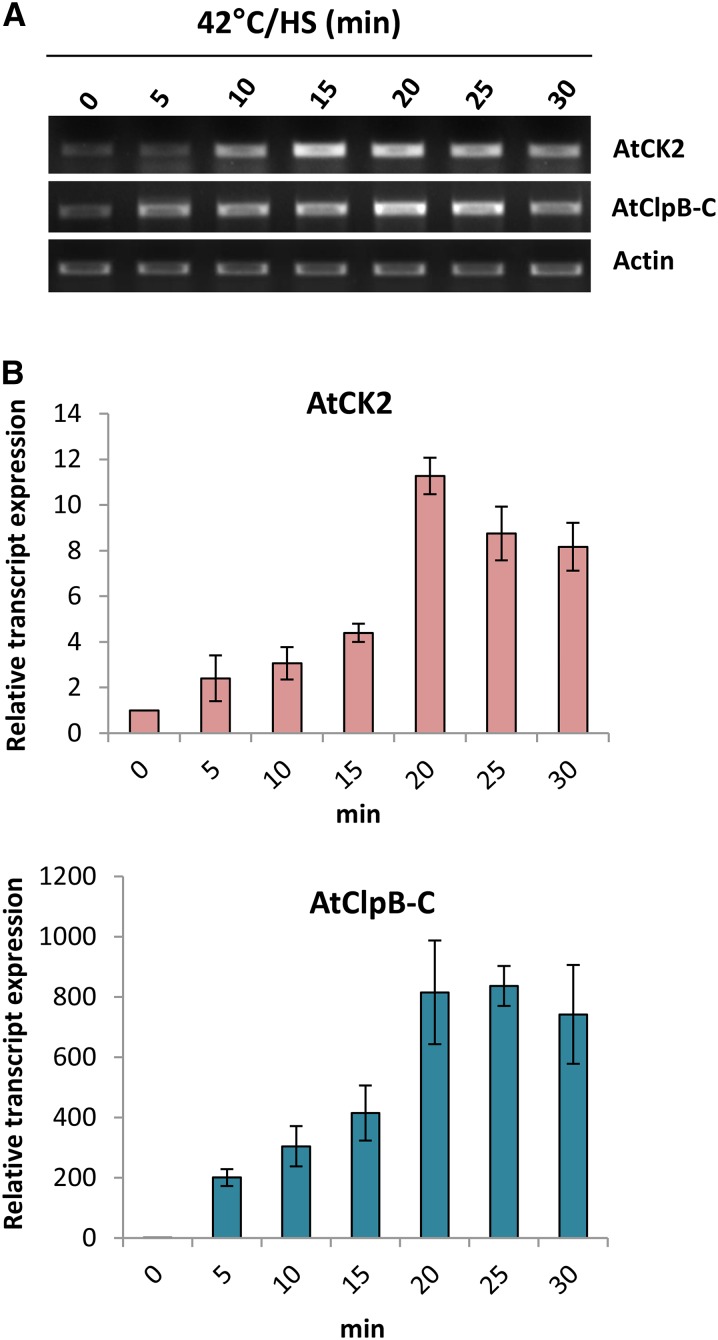
Figure 4.
A, sqRT-PCR data showing the transcript levels of AtClpB-C and AtCK2 genes under 0, 5, 10, 15, 20, 25, and 30 min of HS treatment (42°C). The bottom row shows the standardization with actin primers. B, Real-time PCR data showing the relative transcript abundance of both the genes under similar stress regimes. [See online article for color version of this figure.]

