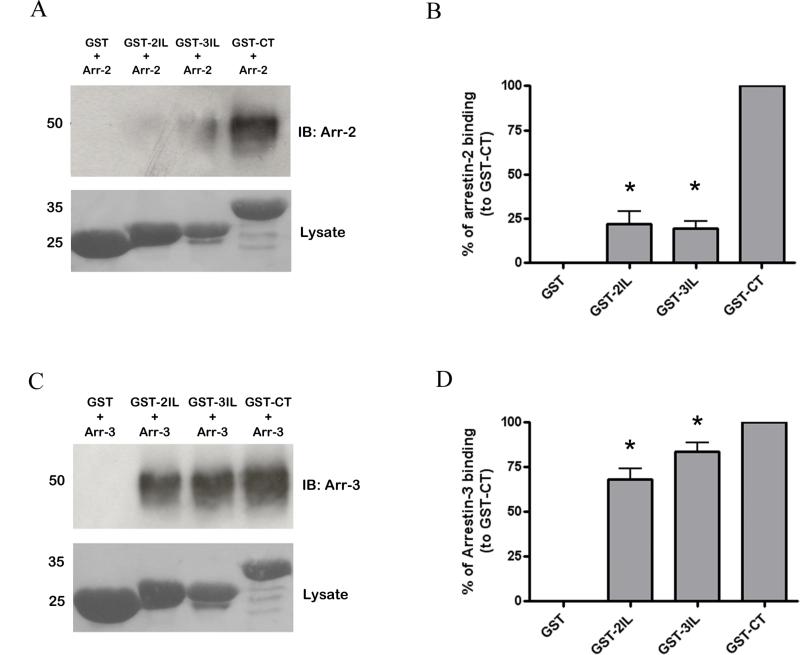
Fig. 5.
Arrestin-2 and -3 interaction with GST fusion proteins of the intracellular regions of MOPr. Purified (A, B) arrestin-2 or (C, D) arrestin-3 (final concentration 500 ng/ml in each case, approximately 11 nM) was incubated with GST alone or with GST-2IL, GST-3IL or GST-CT. Example blots are shown in (A) and (C), whilst bar graps of data from 3-4 experiments are shown in (B) and (D). These results are shown as a % of arrestin binding to the GSTCT, taken as 100%, with error bars representing S.E.M. * p < 0.05 compared to binding of relevant arrestin to GST-CT, one-sample t test.

