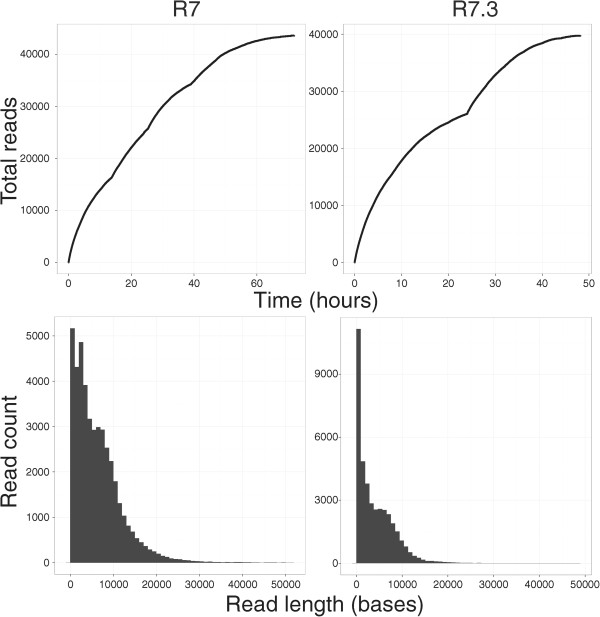
Figure 2.
The top row plots demonstrate collector’s curves of sequence reads over time measured in hours for the R7 (left) and R7.3 (right) run. Visible on the R7 run is a change in rate of read acquisition associated with topping-up the flowcell with additional library at hours 12, 24, 36 and 48. For the R7.3 run, the updated MinKNOW software reselects sequencing wells after 24 hours. The bottom row shows the histogram of read counts for reads shorter than 50,000 bp in length for the R7 (left) and R7.3 (right) run.

