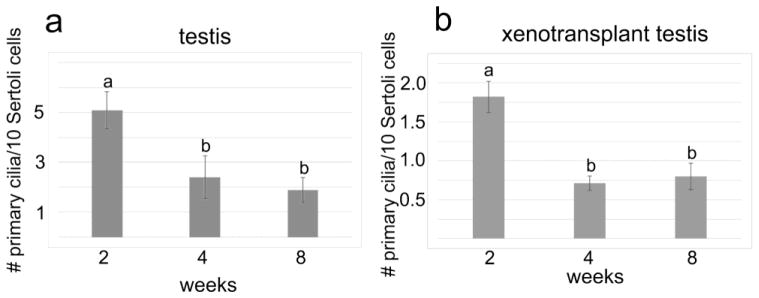
Fig. 6.

Quantitation of pig testis primary cilia during development. (a) Average number of primary cilia in pig testis (of indicated age) per 10 Sertoli cells. Error bars represent standard deviation; a and b indicate statistically significant differences (P<0.01). (b) Average number of primary cilia per 10 Sertoli cells in pig testicular cell xenotransplants. Primary cilia on 250 – 600 Sertoli cells were counted per sample. Error bars represent standard deviation; a and b indicate statistically significant differences (P<0.01)
