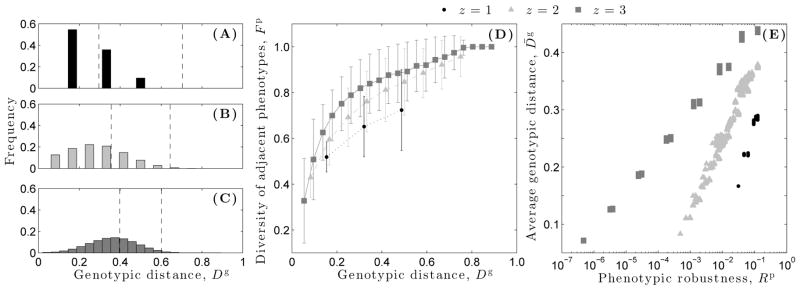
Figure 5.

Distribution of the genotypic distance Dg between randomly sampled pairs of genotypes from focal genotype networks in each of the three dynamical regimes: (A) ordered (z = 1), (B) critical (z = 2), and (C) chaotic (z = 3). The dashed vertical lines represent one standard deviation from the mean of the corresponding null distribution (see text). (D) Diversity of adjacent phenotypes Fp as a function of genotypic distance Dg. Data are offset in the horizontal dimension for visual clarity. Error bars denote one standard deviation from the mean. (E) Average genotypic distance per genotype network, as a function of phenotypic robustness Rp.
